Fig. 9.
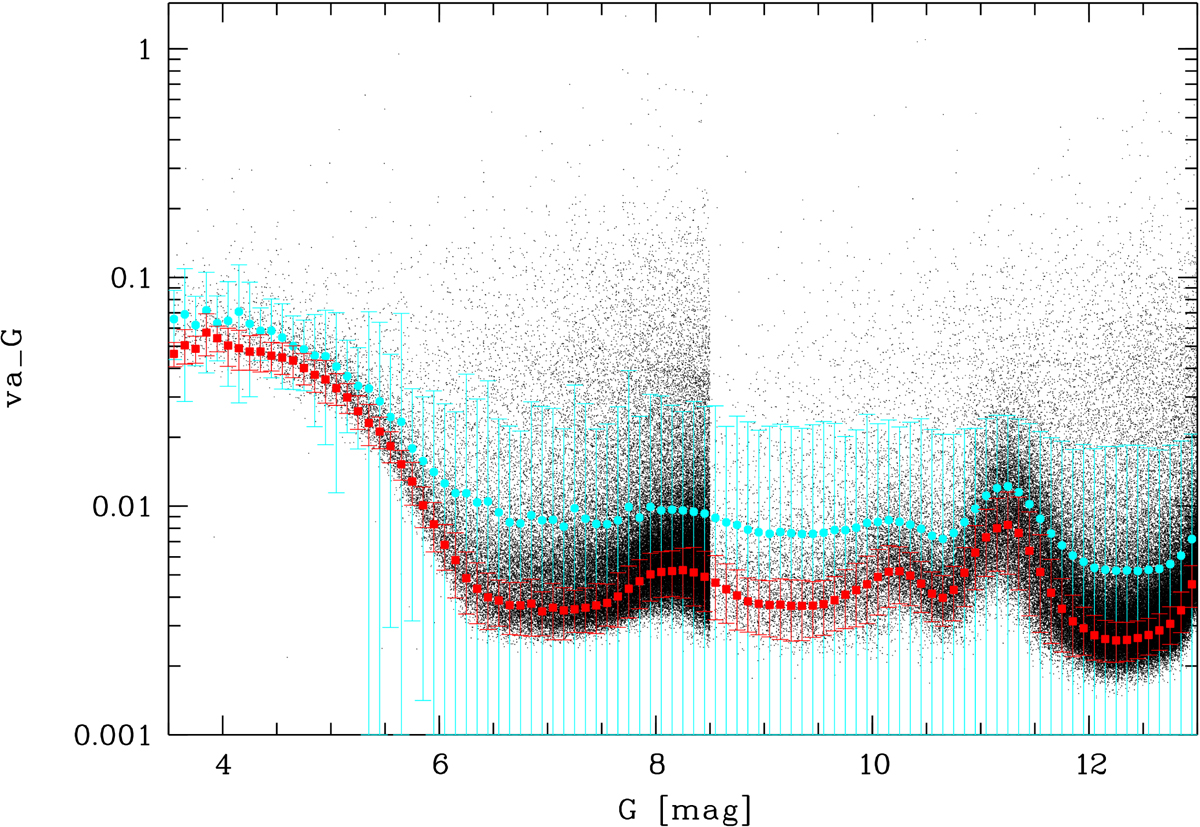
G-band variability amplitude (va_G) of all Gaia DR2 sources with G < 13 mag, excluding those with known variability flags and with RUWE > 1.4, as a function of G magnitude. All objects at G < 8.5 mag but only every 50th object at G > 8.5 mag are plotted as black dots for clarity. Overplotted cyan symbols and error bars show the simple mean values and standard deviations in 0.1 mag wide intervals, whereas red symbols and their error bars show the corresponding results from Gaussian fits.
Current usage metrics show cumulative count of Article Views (full-text article views including HTML views, PDF and ePub downloads, according to the available data) and Abstracts Views on Vision4Press platform.
Data correspond to usage on the plateform after 2015. The current usage metrics is available 48-96 hours after online publication and is updated daily on week days.
Initial download of the metrics may take a while.