Fig. 10.
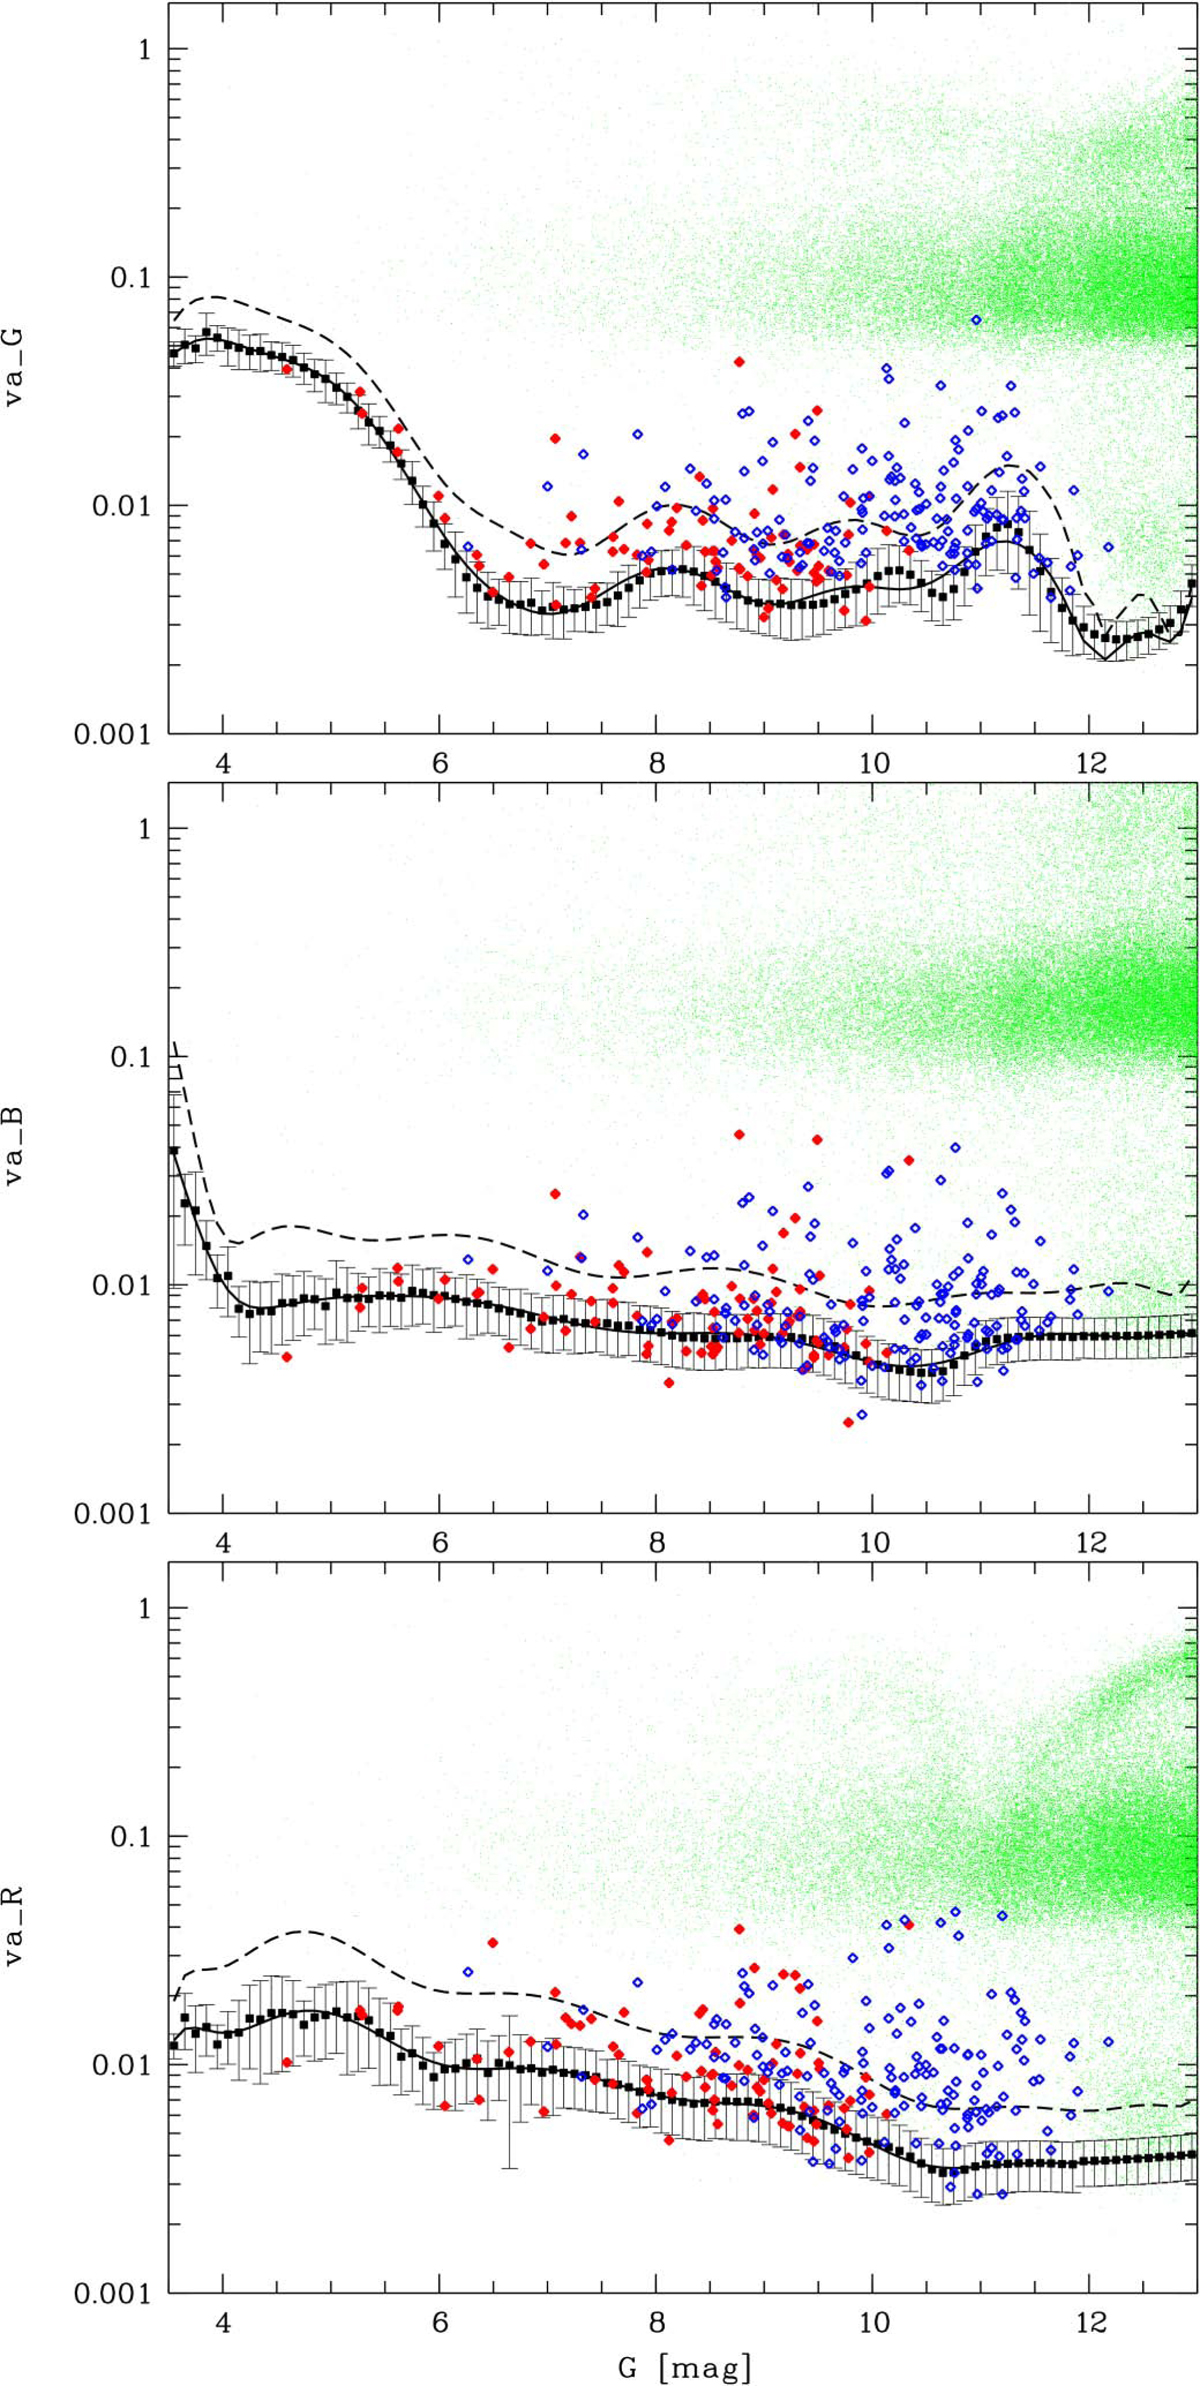
Top: G-band variability amplitudes (va_G) as a function of G magnitude for all objects (3.5 < G < 13 mag) that are flagged as variables in Gaia DR2 (green dots). Black filled squares and error bars show the Gaussian centres and standard deviations computed from the Gaussian FWHM for objects without a variability flag and with RUWE < 1.4, respectively, in each 0.1 mag wide interval. An 18th-order polynomial fit of the Gaussian centres resulted in the black solid line. The black dashed line represents three times of the standard deviations (also obtained from an 18th-order polynomial fit) added. Overplotted are the data for the old (filled symbols) and new (open symbols) Ap stars. Middle: va_B using 12th-order polynomials. Bottom: va_R with 15th-order polynomials.
Current usage metrics show cumulative count of Article Views (full-text article views including HTML views, PDF and ePub downloads, according to the available data) and Abstracts Views on Vision4Press platform.
Data correspond to usage on the plateform after 2015. The current usage metrics is available 48-96 hours after online publication and is updated daily on week days.
Initial download of the metrics may take a while.