| Issue |
A&A
Volume 628, August 2019
|
|
|---|---|---|
| Article Number | A69 | |
| Number of page(s) | 10 | |
| Section | Extragalactic astronomy | |
| DOI | https://doi.org/10.1051/0004-6361/201935586 | |
| Published online | 08 August 2019 | |
First look at the giant radio galaxy 3C 236 with LOFAR⋆
1
Anton Pannekoek Institute for Astronomy, University of Amsterdam, Postbus 94249, 1090 GE Amsterdam, The Netherlands
e-mail: This email address is being protected from spambots. You need JavaScript enabled to view it.
2
ASTRON, The Netherlands Institute for Radio Astronomy, Postbus 2, 7990 AA Dwingeloo, The Netherlands
3
University of Groningen, Kapteyn Astronomical Institute, Landleven 12, 9747 AD Groningen, The Netherlands
4
Centre for Astrophysics Research, School of Physics, Astronomy and Mathematics, University of Hertfordshire, College Lane, Hatfield AL10 9AB, UK
5
INAF – Istituto di Radioastronomia, Via Gobetti 101, 40129 Bologna, Italy
6
Leiden Observatory, Leiden University, PO Box 9513, 2300 RA Leiden, The Netherlands
7
School of Physical Sciences, The Open University, Walton Hall, Milton Keynes MK7 6AA, UK
8
Space Science & Technology Department, The Rutherford Appleton Laboratory, Chilton, Didcot, Oxfordshire OX11 0NL, UK
9
School of Physics, University College Dublin, Belfield, Dublin 4, UK
10
Hamburger Sternwarte, University of Hamburg, Gojenbergsweg 112, 21029 Hamburg, Germany
Received:
30
March
2019
Accepted:
19
July
2019
Abstract
We have examined the giant radio galaxy 3C 236 using LOFAR at 143 MHz down to an angular resolution of 7″, in combination with observations at higher frequencies. We used the low frequency data to derive spectral index maps with the highest resolution yet at these low frequencies. We confirm a previous detection of an inner hotspot in the north-west lobe and for the first time observe that the south-east lobe hotspot is in fact a triple hotspot, which may point to an intermittent source activity. Also, the spectral index map of 3C 236 shows that the spectral steepening at the inner region of the northern lobe is prominent at low frequencies. The outer regions of both lobes show spectral flattening, in contrast with previous high frequency studies. We derive spectral age estimates for the lobes, as well as particle densities of the IGM at various locations. We propose that the morphological differences between the lobes are driven by variations in the ambient medium density as well as the source activity history.
Key words: galaxies: active / radio continuum: galaxies / galaxies: individual: 3C 236
The LOFAR images (mid and high resolution) are only available at the CDS via anonymous ftp to cdsarc.u-strasbg.fr (130.79.128.5) or via http://cdsarc.u-strasbg.fr/viz-bin/qcat?J/A+A/628/A69
© ESO 2019
1. Introduction
Giant radio galaxies (GRGs) are radio galaxies whose radio emitting regions (jets, lobes) extend over projected distances ≥1 Mpc (Willis et al. 1974; Schoenmakers et al. 1999, 2001; Machalski et al. 2008; Saripalli et al. 2012). Their morphology can be classified as core-brightened Fanaroff–Riley (FRI) or edge-brightened FRII (Fanaroff & Riley 1974). There is no evidence that they are particularly more energetic than the general population of radio galaxies (e.g. Lara et al. 2001).
A low-density environment may be the key factor enabling their growth to such large sizes. Mack et al. (1998) have indeed found that the surrounding medium for their sample of GRGs is an order of magnitude less dense than that around smaller radio sources. Hence the radio sources can expand freely, implying that expansion losses rather than radiative losses are the dominant energy loss mechanism for the relativistic particle populations in the radio lobes.
Apart from their size, GRGs are not fundamentally different from other radio galaxies, and they are expected to be subject to the same processes that are present in smaller radio galaxies. The active galactic nuclei (AGN) that power them go through a cycle of active and inactive periods (e.g. McNamara & Nulsen 2007; Morganti 2017). Hence, we might expect GRGs to show evidence of multiple activity episodes, both in their radio morphology and spectra. They may exhibit double-double morphologies (some examples can be found in the sample of Malarecki et al. 2013) and show signs of spectral curvature indicating radiative ageing of the relativistic particles responsible for their extended radio emission.
There are several studies of the ages of GRGs using radio data. Mack et al. (1998) performed radiative ageing analysis of five giant radio galaxies (including 3C 236), obtaining ages less than 400 Myr. More recently Hunik & Jamrozy (2016) have presented a restarted giant radio galaxy for which they derive a radiative age of 160 Myr. Also, Cantwell et al. (in prep.) studied NGC 6251 and found ages raging from 50 Myr to greater than 200 Myr. Orrù et al. (2015) studied the famous double-double GRG B1864+620 and showed that the source ages derived for its outer pair of radio lobes indicate that the AGN activity has stopped in the recent past.
For many years following its discovery in the late 1950s, 3C 236 was an unresolved source. It was catalogued as such in the first 3C catalogue and kept its status up to and including the study of Pooley & Henbest (1974). However, using the Westerbork Synthesis Radio Telescope (WSRT), Willis et al. (1974) discovered low surface brightness radio lobes emanating from the compact source, extending over a total projected linear size of 4.5 Mpc (z = 0.1005)1. For decades, it was the largest known radio galaxy (but see Machalski et al. 2008, for the current record holder), hence 3C 236 is listed as a GRG in radio survey catalogues.
Barthel et al. (1985) investigated the radio morphology of 3C 236 at a variety of scales. They noted that the low surface brightness emission of the lobes, especially the north-west (NW) one, shows a large-scale (300 kpc) wiggle, possibly associated with the jet slightly changing its orientation over the source’s lifetime (see their Fig. 4). The NW lobe terminates in a diffuse plateau, and there is an inner hotspot embedded in it, which may indicate a separate episode of AGN activity or intermittent accretion. The south-east (SE) lobe is more extended and shows a double hotspot morphology, which the authors suggest may be caused by an oblique shock deflecting the jet. Strom et al. (1981) studied the spectral index variations across the lobes and found that the spectral index steepens going from the outer edges of the lobes towards the host galaxy, similar with that observed in (hotspot dominated) FRII radio galaxies.
The host galaxy of 3C 236 has been studied in detail by Martel et al. (1999), O’Dea et al. (2001), and Tremblay et al. (2010). Hubble Space Telescope (HST) imaging has revealed repeated bursts of star formation (on timescales of ∼107 and ∼109 yr) in a warped dusty disc surrounding the AGN. This suggests that the younger starburst may be connected to the AGN reactivation that produced the currently active compact steep spectrum (CSS) radio source at its centre (Tremblay et al. 2010). Thus, 3C 236 is an example of a radio galaxy showing signs of multiple epochs of radio activity.
The central regions of this radio galaxy are rich in gas. Atomic neutral hydrogen was revealed as a deep narrow absorption feature near the systemic velocity by van Gorkom et al. (1989). The distribution of this gas was studied at high spatial resolution using very long baseline interferometry (VLBI) techniques by Struve & Conway (2012), who postulate that the radio source interacts with the cold interstellar medium (ISM) gas. Morganti et al. (2005) have discovered a broad and shallow wing, blueshifted up to 1000 km s−1. This absorption is associated with a fast outflow (a feature shared by a number of restarted radio galaxies), and has been recently traced also on VLBI (pc) scales (Schulz et al. 2018). The presence of cold molecular gas (traced by CO) was found by Labiano et al. (2013), using the Plateau de Bure Interferometer at 209.5 GHz. The gas appeared to be rotating around the AGN, and was observed to be co-spatial with the dusty disc in which the AGN is embedded.
With the advent of the LOw Frequency ARray (LOFAR; van Haarlem et al. 2013) it is now possible, for the first time, to study extended GRG morphology in a comprehensive manner at very low frequencies. LOFAR is sensitive to extended low surface brightness features due to its dense sampling of short spacings in the UV plane, while at the same time enabling high spatial resolution imaging to leverage its long (Dutch) baselines.
Within the framework of the LOFAR Surveys Key Science Project, the nearby AGN working group has observed two GRGs: 3C 236 and NGC 6251. These are among the largest GRGs and have never been studied in such detail as LOFAR can provide in its frequency range. In this work, we present the results related to 3C 236. Our goal is to perform high resolution mapping of the radio morphology of its extended structure at the lowest frequencies to date, enabling us to trace the oldest emission regions. Our aim is also to extend the (resolved) spectral index studies of this object by a factor of two lower in frequency compared to previous studies. This enables us to place tighter constraints on the source energetics and activity history, tying in with previous studies of this object.
The organization of this work is as follows. Section 2 describes the observations and the reduction procedure. In Sect. 3 we outline our results, discuss them in Sect. 4, and conclude with Sect. 5.
2. Observations
2.1. LOFAR observations
The observations were performed with the LOFAR telescope operating in high-band (HBA) mode, for a total on-source time of 8 h, on the morning of October 9, 2018. Details of the observation are given in Table 1. Main and secondary calibrator scans were also performed before and after the target observation, ten minutes each in duration.
LOFAR configuration.
The data were initially pre-processed (flagged and averaged) by the LOFAR observatory pipeline (Heald et al. 2010). The station gains were determined using the main calibrator pointing and set to the Scaife & Heald (2012) flux density scale.
To image the entire field of view (FoV) at these low frequencies, the influence of the ionosphere has to be properly taken into account. The observation used was part of the ongoing LOFAR Two-metre Sky Survey (LoTSS) project and the data were processed using its reduction pipelines which perform directional (self) calibration and imaging. For a full description, please refer to Shimwell et al. (2017, 2019).
3C 236 was the brightest source in the field, and our main source of interest, so we did not calibrate and image across the entire FoV, focusing only on the area around the target (Tasse et al. in prep., van Weeren et al., in prep.). The calibrated data set (with uv-coverage as shown in Fig. 1) was imaged with WSclean (Offringa et al. 2014) using multi-scale cleaning; scales of 0−2n, n = [2, 6] pixels. The image shown in the main panel of Fig. 3 was obtained using a UV taper of 7.4 kλ and Briggs weights with robustness set to −0.5. To emphasize source structure on the smallest scale, we have imaged without tapering using the same weights as described previously. The final image properties are listed in Table 2.
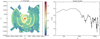 |
Fig. 1. UV coverage (left) and its radially averaged profile of the LOFAR data. |
Image properties.
LOFAR flux densities are known to suffer from a systematic effect when the amplitude scale is set by transferring the gains from calibrator to target pointing. Different elevations of the target and calibrator sources will yield different gain normalization of the LOFAR beam pattern, which can appear as a frequency dependent flux density offset (Shimwell et al. 2019). To further verify our flux scale as measured from the images we have obtained, a check was performed measuring the flux density of the unresolved bright core as well as another nearby point source and comparing it with catalogue values; we found a residual flux excess of 42% which we corrected for by down-scaling the LOFAR image.
2.2. Data from the literature
In order to perform the spectral study of 3C 236, we have collected images from the literature that trace the emission of the extended lobes and could be combined with the LOFAR data. This combination needs to be done with care and in Sect. 3.2 we comment more on the caveats.
We have used legacy Very Large Array (VLA) survey (NVSS2), as well as Westerbork Synthesis Radio Telescope (WSRT) images. The image properties are listed in Table 2. The mid and high resolution LOFAR images are shown in Fig. 3. The images collected allows us to produce spectral index maps and derive the spectral curvature and ages of the lobes.
In Fig. 2 we plot the integrated source flux density measurements taken from the study of Mack et al. (1997) (with frequency coverage up to 10 550 MHz, given in Table 3), together with those measured in our low resolution LOFAR map and the NVSS map, both listed in Table 2.
Integrated flux density values.
The LOFAR integrated flux density (marked in red) shows a slight flattening of the integrated source spectrum at low frequencies compared to the points at high frequency. This is to be expected, as we shall discuss in the forthcoming sections of this work. This flattening was hinted at in previous studies (e.g. Mack et al. 1997). As can be discerned from Fig. 2, the flux density scale of our LOFAR observations is as expected, within the errors.
3. Results
3.1. Total intensity structure of 3C 236 at 143 MHz
The intermediate resolution image (23.8″ × 19.2″) of 3C 236 obtained with LOFAR is shown in the main panel of Fig. 3, while the insets zoom in on the two lobes and show their morphology as it appears in our high resolution LOFAR image. Figure 4 shows the contour levels of the emission at lower resolution (50″), emphasizing better some of the new low surface brightness features detected by LOFAR. An overview of the images is presented in Table 2. The map presented in Fig. 3 shows some residual artefacts due to limitation in the calibration around the stronger sources (e.g. the central, very bright compact core of 3C 236), while the regions of diffuse emission are less affected.
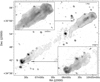 |
Fig. 3. LOFAR intensity map (linear scale, level limits at 1 and 150 mJy beam−1) of 3C 236 at 143.6 MHz. Fifteen positive contours are overlaid as solid grey lines with levels at |

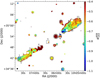 |
Fig. 4.
|


Despite the huge source size (more than half a degree), the LOFAR observations recover the full extent of the source showing, for the first time, its structure at low frequencies and relatively high spatial resolution. The image reproduces well the main (previously known) morphological features of 3C 236 (Barthel et al. 1985).
The overall structure (about 40′ in size, corresponding to 4.32 Mpc) consists of two very elongated lobes. The NW lobe radio emission is more extended transversely to the longitudinal symmetry axis (jet propagation direction) compared to the SE lobe (about 4′ and 2′ in width towards the NW and SE respectively). At the resolution of the LOFAR observations, the central region including the restarted CSS is unresolved. The asymmetry of the large-scale structure, with the SE lobe extending farther away from the core compared to the NW, is also confirmed by the LOFAR images. Given the size of the source, projection effects are unlikely and hence the source asymmetry must be intrinsic.
The LOFAR images (especially the one at intermediate resolution) show that both lobes extend all the way to the core. The emission connecting the SE lobe to the core has very low surface brightness (around 0.5 mJy beam−1), nevertheless maintaining its width for the full length of the lobe (see the intensity contours in Fig. 4). There are no signs of spurs or very extended emission transverse to the lobe extent, with the exception of the extension to the south in the NW lobe, right next to the core (Fig. 4). This extension was earlier seen at higher frequencies, although much weaker (Barthel et al. 1985). It is reminiscent of structures created by back-flows of plasma deposited in the lobe by the jet seen in other (e.g. X-shaped, Leahy & Williams 1984; Hardcastle et al. 2019; Cheung et al. 2009; Saripalli & Roberts 2018) radio galaxies.
The high spatial resolution images of the lobes (seen in the insets of Fig. 3) show that in the NW lobe, the leading edge does not show a hotspot, but only a diffuse enhancement in surface brightness. However, as first noted by Barthel et al. (1985), there is a compact region in the middle of the lobe, confirmed by the LOFAR image (Fig. 3). This inner lobe region is split in two clumps (marked by a dashed ellipse in Fig. 3), the leading one of which is probably a jet termination (hotspot). Structures of this type are seen in other objects (cf. Malarecki et al. 2013). The location of the hotspot within the lobe suggests that it may trace a separate event of source activity, propagating through the lobe, or tracing an interruption (flicker) in the accretion history of the activity episode that produced the large-scale lobes. At the end of the SE lobe, a double hot-spot appears to be present (see bottom right inset in Fig. 3). For the first time, we observe that the southern hotspot of the pair has itself a double structure, having two distinct brightness peaks (labelled H2 and H3 in the lower right inset of Fig. 3). This may be a sign of a jet interaction with intergalactic medium (IGM) gas (e.g. Lonsdale & Barthel 1986), possibly indicating that the jet used to terminate at the location of the H1 hotspot, then the termination point moved to H2 and currently is located at H3. This is consistent with the hypothesis that the most compact hotspot is where the jet terminates at the current epoch (Hardcastle & Looney 2001). Also, it would explain why the SE lobe has a steeper spectrum along the northern edge (discussed below). It is also possible that H1 and H2 are created by lateral emission of plasma from the H3 termination shock. In the 3CR sample, one-sixth of the sources have multiple hotspots; the statistics vary depending on the definitions used and source samples under consideration (Valtaoja 1984).
The differences in the structure of the lobes in 3C 236 suggest that they are not only the results of intermittence in the activity or changes in the position angle of the jet. Other effects due to for example the propagation of the jets in the inner region, must have affected the large-scale morphology.
Given the overall size of the source (more than half a degree), several unresolved background sources are embedded in the lobe emission. Their positions are noted in Mack et al. (1997). Some of these sources are relatively bright, but we find that they do not present an issue for our analysis.
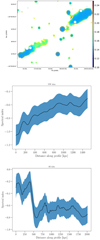 |
Fig. 5. Spectral index error (top panel) and spectral index profiles along the paths shown in Fig. 4. The profile paths start in the inner part of the lobes. The shaded area in the spectral profile plots represents the spectral index error. |
3.2. Spectral index
We have derived a low frequency spectral index (S ∝ να) map between 143 and 609 MHz using the images listed in Table 2, implementing the following procedure. The 609 MHz image (from Mack et al. 1997) was first re-gridded to a J2000 epoch, then we registered the lowest resolution 143 MHz and the 1400 MHz image to the same pixel scale as the 609 MHz image. Finally, we convolved the images with a Gaussian kernel resulting in a circular PSF of 50″. The re-gridding and convolution were performed using the imregrid and imsmooth CASA (McMullin et al. 2007) tasks.
Producing spectral index images from data sets taken with different telescopes is always subject to caveats. In particular, observations at different frequencies must be sensitive to similar spatial structures. The UV-coverage of the data sets can help in checking whether this condition is fulfilled. The UV-range of the mid-resolution LOFAR image (from which the lowest resolution LOFAR map is obtained by convolution) is well matched to that of the WSRT image (upper cut of around seven kλ), so the low frequency spectral index derivation is unaffected by spatial filtering. The NVSS image has relatively few short spacings, that is, it is less sensitive to extended emission (Condon et al. 1998; Jamrozy et al. 2004). We keep this limitation in mind when interpreting our (spectral ageing) results.
The flux density scale was taken to be uncertain at a level of 20% for the LOFAR (Shimwell et al. 2017) and 5% for the WSRT (Mack et al. 1997) and VLA (Condon et al. 1998) observations, respectively. We added these uncertainties in quadrature to the r.m.s. errors of the corresponding maps.
We have derived the  spectral index using the standard expression: α = log(S1/S2)/ log(ν1/ν2). We show the results in Fig. 4, restricted to pixels having flux density values above 5σ in the corresponding images. The spectral index errors were obtained by error propagation of the flux density errors in the corresponding images:
Here, δS represents the flux density measurement error. The resulting spectral index error map is shown in Fig. 5, top panel.
We have also measured flux densities in eleven characteristic regions, (along the lobes, encompassing the lobe termination regions and across the NW lobe). These numbered regions are listed in Table 4, and indicated in Fig. 4. For each region we have computed the spectral index to investigate whether differences with the values reported in the spectral index map (which samples smaller spatial scales) are present. We find no significant deviations, indicating the robustness of the spectral index map. Also, we show the spectral index profiles along both lobes; the profiles are indicated as dashed lines in Fig. 4.
The spectral index map shows that the outer lobe regions have spectral index values (between −0.5 and −0.65) typical regions with ongoing particle acceleration. This is also observed in the embedded hotspot region in the NW lobe and in the hotspot in the SE lobe (although here the spectral index is around −0.1 dex steeper). The spectral index generally steepens (see bottom two panels in Fig. 5) toward the edges of the lobes and toward the core (consistent with the FRII overall source morphology), indicating loss of energy and (spectral) ageing of the particle populations as they back-flow in the direction of the core. However, curiously, the SE lobe has a region of very flat spectral index in its core-facing end; a hint of this region is also observed in the higher frequency spectral index maps of Mack et al. (1998). These trends are shown in the spectral index profiles of the lobes presented in Fig. 5. The SE lobe has the flattest spectral index along its southern edge. There is a transition to steeper spectral index values of ∼ − 0.9 along the northern edge of its outer region. Whereas the interpretation of the spectral index map in this region is not straightforward, the observed steepening could be real at least in some parts and warrants further investigation in future studies of this object.
Mack et al. (1998) derive  spectral indices for the NW lobe of around −1 for the outer regions to −1.2 going toward the core. Our
  spectral index map shows much flatter spectral index values, around −0.5 to −0.6, (cf. the spectral profiles in Fig. 5) meaning that LOFAR detects the particle population related to the primary injection of energy in the lobe. For the SE lobe, the agreement between our spectral index values and those derived by Mack et al. (1998) is better, although we have flatter values, with
  versus their values of
  for the outer lobe. We have derived the spectral index for several regions in the source (Table 4) to test whether the values we obtain in our spectral index map are reliable; the spectral index values per region match those from the map. High resolution mapping helps to disentangle the detailed spectral behaviour.
3.3. Source energetics and radiative ages
Before discussing the 3C 236 energetics, we estimate the magnetic field value throughout the source. We make the assumption that the field structure in the lobes is uniform and oriented perpendicular to the line of sight. We use cylindrical geometry for the lobes, and calculate the magnetic field strength assuming that equal energy is contained in the relativistic particles and the field (equipartition assumption). Furthermore, we set the ratio of electrons to protons to unity, as well as the filling factor of the lobes. We adopt limits of the spectral range from 10 MHz to 105 MHz, and we set the spectral index of the radiation in this range to α = −0.85 (taking into account the observed values at low frequencies, as well as assuming spectral steepening to higher frequencies). Using the relation by Miley (1980), calculating at a frequency of 143 MHz (Table 5) and averaging over both lobes, we obtain B = 0.75 μG for the equipartition magnetic field strength. As was noted by Brunetti et al. (1997), the equipartition field calculated in this manner should be corrected, to take into account a low energy cut-off value for the spectrum of the particles and a value for the particle spectral index at injection time. With γmin = 200, and αinj = −0.75 (average low frequency spectral index in the lobes), we find B = 1.28 μG for the average source magnetic field, a value we will be using further in our analysis. This value of the magnetic field is lower than the CMB equivalent magnetic field at the source redshift (BCMB = 3.93 μG). Thus, the dominant energy loss mechanism of the relativistic particles generating the synchrotron radio emission will be inverse Compton scattering off the omnipresent CMB photons.
Source parameters and derived quantities.
The spectral ages of the emitting regions are calculated using two different approaches: first for the regions defined in Fig. 4 and second for measurement regions encompassing the NW and SE lobes separately, avoiding embedded point sources and measuring out to the 5σ contour in the 143 MHz image. We have used the fitintegrated and fitcimodel tasks of the BRATS 3 software package (Harwood et al. 2013, 2015) for the two cases respectively. The fitting was performed using flux density measurements at three different frequencies, using the low resolution LOFAR image and the WSRT and VLA images listed in Table 2. In the fitintegrated task we fitted a Jaffe–Perola (JP, Jaffe & Perola 1973) model, and the fitcimodel task fits a continuous injection (CI) model to the integrated flux densities for the source regions under consideration. The CI model was used when modelling the lobes assuming that they encompass regions where particle acceleration is ongoing, which can not be stated for (all) of the smaller measurement regions. Although the models do not give intrinsic ages (Harwood 2017), they are useful to address the source properties. The injection spectral index was kept fixed for each fitting run, and the fitting was performed over a search grid spanning values from αinj = −0.2 to αinj = −0.9. The derived spectral ages and spectral break frequencies (in the CI fit case) resulting from the fitting procedure are shown in Table 4. The average reduced χ2 measure for the goodness of the fit (one degree of freedom) is given in the last column. The fit results are shown in Fig. 6.
The derived ages for individual regions indicate older plasma as one goes from the lobe outer edges toward the core, consistent with what would be expected if the main acceleration regions are located in the outer lobes. The injection spectral indices which best fit the data are not steep, indicating that LOFAR is probing particles which have retained their energy since their acceleration phase. We will discuss the spectral ages further in Sect. 4.
The particle energy assuming equipartition can be expressed as (Mack et al. 1998; Pacholczyk 1970)
![Mathematical equation: $$ \begin{aligned} {E}_{\mathrm{eq}} = \dfrac{7}{4}\left[(1+{k}){c}_{12}{P}\right]^{\frac{4}{7}}\left(\dfrac{\Phi {V}}{6\pi }\right)^{\frac{3}{7}}, \end{aligned} $$](/articles/aa/full_html/2019/08/aa35586-19/aa35586-19-eq23.gif)
where Φ = 1 is the volume filling factor, V the volume of the region filled with relativistic particles and fields, k(= 1) the electron to proton ratio, P the radio luminosity integrated over the earlier specified frequency range, for the regions under consideration, and c12 is a constant (in our case c12 = 1.6 × 10⁷; Pacholczyk 1970).
Assuming that the lobes are in pressure balance with the IGM, the relativistic gas pressure in the lobes, pl
4 should balance with the gas pressure of the IGM (pIGM = nIGMkT), where k is the Boltzmann constant and T the temperature of the IGM in degrees Kelvin. Adopting T = 107K, we can roughly estimate the IGM particle density values  (Mack et al. 1998; Hunik & Jamrozy 2016), and list the resulting values in Table 5.
4. Discussion
Our LOFAR imaging recovers the source structure as described previously in the literature (Barthel et al. 1985; Mack et al. 1997), and discussed in the previous section of this work. Owing to the high surface brightness sensitivity in our LOFAR images, we can now trace the SE lobe emission all the way to the core even in the intermediate resolution maps. We note that the NW lobe is shorter than the SE lobe. Interestingly, this asymmetry is inverted for the small-scale emission of the CSS core. There, the NW extension is longer than the SE as seen by Schilizzi et al. (2001). They also speculate that the dust lane imaged by HST close to the core may be part of the material that helps collimate the radio emission.
As was noted in Sect. 1, there is a hint of a slight wiggle of the ridge line connecting the core and the outer lobe edges. It is visible in Fig. 3 as a departure from the symmetry axis in the NW lobe, where the inner hotspot and the outer diffuse region are not on a straight line to the core. This may be due to the wobble of the jet as it drills through the IGM and intracluster medium (ICM) over time. In this context, the appearance of the SE lobe hotspot is intriguing. It was described as a double hotspot in the literature (Barthel et al. 1985); now, using LOFAR, we can see that it is in fact a triple hotspot; the southern component is split in two (Fig. 3). It may be that the jet was deflected at the hotspot producing the observed morphology, or that the jet working surface has shifted over time. Lonsdale & Barthel (1986) have suggested that such hotspots can originate from a flow redirection in the primary hotspot.
O’Dea et al. (2001) have classified 3C 236 as a double-double (Saikia & Jamrozy 2009; Orrù et al. 2015) radio galaxy, since the restarted activity in the core has extended emission aligned with the large-scale lobes. Then, 3C 236 may be a “triple-double” radio galaxy; the inner hotspot in the NW lobe signifying a stall in the jet, or a short sputter in the accretion episode responsible for the creation of the large-scale lobes. In this view, the diffuse outer region of the NW lobe is the (still active) remnant hotspot of the previous activity episode and the embedded hotspot is produced by the jet expelled during the re-activation episode, which is still advancing through the lobe material. Within this context, the wiggle noticeable in the source morphology (mentioned above) can be explained by a slight shift in the jet axis during the jet stall or sputter event.
The lobe length asymmetry and the position of the hotspots may be caused by a difference in material density on the opposite sides of the host galaxy, at the position of the lobes, and higher for the NW lobe. This is tentatively supported by the particle density we have derived, presented in Table 5, which is ∼3 times higher than the medium density obtained by Mack et al. (1997) and hence broadly comparable with their result.
Owing to their sizes, GRGs can be used as probes of the physical conditions of the IGM. Malarecki et al. (2013) have performed such a study on a sample of 19 GRGs; we are in agreement with the values they have derived for the mean lobe pressures in their sample (ranging from 1.34 × 10⁻¹⁵ to 1.91 × 10⁻¹⁴ Pa). In a subsequent study of the same sample Malarecki et al. (2015) find that GRGs tend to occur in sparse environments (such as the one of the 3C 236 host galaxy), and they show tentatively that shorter lobes expand in regions of (on average) higher galaxy density. This may be relevant to explain the lobe morphology of 3C 236. Further studies on the immediate environment of the host galaxy of 3C 236 should test this hypothesis. If true, the environment should be denser to the north-west, where the shorter lobe extends. On the other hand, the large-scale asymmetry and the (reverse) small-scale asymmetry may have a physical origin in asymmetric host galaxy properties.
Recent studies of the GRG NGC 6251 by Cantwell et al. (in prep.) have found ages for its lobes of less than 50 Myr, and show that the newly discovered faint lobe extensions have ages greater than 200 Myr. The radiative ages for the lobes of 3C 236 we derive fall in between of the ages derived for the different regions of NGC 6251. Given the morphological difference between the lobes of these two GRGs (the lobes of NGC 6251 are far less confined, and it is an FRI radio galaxy), the results of the studies are consistent. The lobe pressure values they find (4.9 × 10⁻¹⁶–4.8 × 10⁻¹³ Pa) are also consistent with our findings. Our derivations of the lobe ambient medium assume that the lobes are in pressure balance with the IGM. One may find this assumption objectionable, as radio galaxy lobes are often observed to be under-pressured. However, Croston & Hardcastle (2014) have argued that FRIs can be in pressure balance if there is entrainment of surrounding material by the jet flow. Recent reports that FRI lobes are energetically dominated by protons Croston et al. (2018) seem to support the entrainment scenario. Similarly, Harwood et al. (2016, 2017) argue that FRIIs can be brought back into agreement by considering the steeper than expected injection index which is sometimes derived using model fits to data from low-frequency observations.
Our 3C 236 spectral index map, with the highest spatial resolution obtained so far at these frequencies, allows us for the first time to associate morphological and spectral features. We clearly see a flatter (compared to the surrounding regions) spectral index associated with the inner hotspot of the NW lobe, hinting at it being a particle acceleration region. Also, while previous spectral index maps (Fig. 3, top panel in Mack et al. 1998) only weakly hinted at the spectral index steepening toward the lobe edges, we can now better trace that transition. The curious flattening of the spectral index in the inner SE lobe which was hinted at previously (Mack et al. 1998), now stands out. It can be a signature of the interaction between the jet inflating the SE lobe and the IGM at that position; the spectral index indicating that acceleration is ongoing.
In general, the spectral ages we have derived do not agree with the values published by Mack et al. (1998); these authors obtain lower age estimates (ranging from less than 8 Myr to 20 Myr). The only exception is region two, where our age is broadly comparable with their estimate (they have an age of around 20 Myr for that region of the source, while our value is around 50 Myr, both using the JP model). The ages we derive measuring the integrated flux density of the lobes are substantially higher than what Mack et al. (1998) derive. The fact that the age for region eight using the single-injection JP model is comparable with the age for the NW lobe derived using the CI model, suggests that our ages are a more robust measure of the characteristic age compared to previous studies. The break-frequencies in our model lobe spectra are located in the lower frequency range of the data used by Mack et al. (1998), which is consistent with the fact that we measure flatter spectral indices in the lobes. LOFAR can trace the spectral flattening towards still lower frequencies, and thus characterize the spectral break.
The age difference between these studies is most likely due to the fact that LOFAR measures the emission from the oldest particle population, affecting our estimates. It should also be noted that due to the uncertainties in the assumed values of the input parameters (especially the magnetic field value; Mack et al. 1998 use values between 0.3 μG and 0.7 μG), uncertainties in the model, mapping resolution as well as the sparse frequency coverage, these ages should be taken as limits to the actual values.
Our age estimates support a scenario where the lobes are built up by a jet advancing with a speed of around 0.1c (as argued by Barthel et al. 1985), that is, that speed is required to inflate the lobes to their present linear size in a time broadly consistent with their derived ages (overall ages based on the CI model). Further, as was already mentioned in the introduction section of this work, O’Dea et al. (2001) suggest (based on their HST studies of star formation in the nucleus of the host galaxy) an age of the large-scale lobes in the range of 108–109 years, in line with our findings.
5. Conclusion
We have presented new LOFAR observations of the GRG 3C 236. We have studied this radio galaxy for the first time at a resolution of up to 6″ at 143 MHz. Also, we have derived the highest resolution spectral index maps to date (at 50″ resolution). Our main conclusions are:
-
We observe an inner hotspot in the north-western lobe, separate from its more diffuse outer region. It is also discernible in the spectral index map, as a region undergoing more recent particle acceleration (flatter spectral index values). This detection, taken together with the overall source morphology, may be an indication of a short interruption of the accretion episode and jet sputter.
-
The brighter component of the SE lobe double hotspot is resolved in two components, making this feature a triple hotspot.
-
The source energy and pressure balance with the IGM suggests that confinement by the IGM may be responsible for the morphology of the lobes; the NW lobe is probably confined and the SE one has expanded in a lower density medium, reflected in the somewhat steeper spectrum of its northern edge.
-
The derived spectral ages are consistent with a jet advancing at 0.1c in the surrounding medium of the host galaxy.
LOFAR is a valuable instrument for studies of giant radio sources. Its sensitivity to low surface brightness features, combined with its capability for high resolution imaging at low frequencies, offers an unprecedented detailed view of source emission regions containing low energy plasma. This is useful to uncover previously unknown features even in targets which have been studied for decades, such as 3C 236.
We assume a flat ΛCDM cosmology with H0 = 67.8 km s−1 Mpc−1 and Ωm = 0.308, taken from the cosmological results of the full-mission Planck observations (Planck Collaboration XIII 2016), and use the cosmology calculator of Wright (2006). At the redshift of 3C 236, 1″ = 1.8 kpc.
NVSS stands for the NRAO VLA Sky Survey carried out at a frequency of 1.4 GHz (Condon et al. 1998).
pl = (γ − 1)eeq, where eeq = Eeq/V is the lobe energy density and γ is the ratio of specific heats; for relativistic gas  .
.
Acknowledgments
LOFAR, the Low Frequency Array designed and constructed by ASTRON, has facilities in several countries, that are owned by various parties (each with their own funding sources), and that are collectively operated by the International LOFAR Telescope (ILT) foundation under a joint scientific policy. We would like to thank Karl-Heinz Mack for providing fits images for the previously published WSRT map. RM gratefully acknowledges support from the European Research Council under the European Union’s Seventh Framework Programme (FP/2007-2013)/ERC Advanced Grant RADIOLIFE-320745. MB acknowledges support from INAF under PRIN SKA/CTA “FORECaST” GJW gratefully acknowledges support from the Leverhulme Trust. SM acknowledges funding through the Irish Research Council New Foundations scheme and the Irish Research Council Postgraduate Scholarship scheme. This research has made use of the NASA/IPAC Extragalactic Database (NED), which is operated by the Jet Propulsion Laboratory, California Institute of Technology, under contract with the National Aeronautics and Space Administration. This research has made use of APLpy, an open-source plotting package for Python hosted at http://aplpy.github.com This research made use of Astropy, a community-developed core Python package for Astronomy (http://www.astropy.org).
References
- Barthel, P. D., Schilizzi, R. T., Miley, G. K., Jagers, W. J., & Strom, R. G. 1985, A&A, 148, 243 [NASA ADS] [Google Scholar]
- Brunetti, G., Setti, G., & Comastri, A. 1997, A&A, 325, 898 [NASA ADS] [Google Scholar]
- Cheung, C. C., Healey, S. E., Landt, H., Verdoes Kleijn, G., & Jordán, A. 2009, ApJS, 181, 548 [NASA ADS] [CrossRef] [Google Scholar]
- Condon, J. J., Cotton, W. D., Greisen, E. W., et al. 1998, AJ, 115, 1693 [NASA ADS] [CrossRef] [Google Scholar]
- Croston, J. H., & Hardcastle, M. J. 2014, MNRAS, 438, 3310 [NASA ADS] [CrossRef] [Google Scholar]
- Croston, J. H., Ineson, J., & Hardcastle, M. J. 2018, MNRAS, 476, 1614 [NASA ADS] [CrossRef] [Google Scholar]
- Fanaroff, B. L., & Riley, J. M. 1974, MNRAS, 167, 31P [Google Scholar]
- Hardcastle, M. J., & Looney, L. W. 2001, MNRAS, 320, 355 [NASA ADS] [CrossRef] [Google Scholar]
- Hardcastle, M. J., Croston, J. H., Shimwell, T. W., et al. 2019, MNRAS, 1842 [Google Scholar]
- Harwood, J. J. 2017, MNRAS, 466, 2888 [NASA ADS] [CrossRef] [Google Scholar]
- Harwood, J. J., Hardcastle, M. J., Croston, J. H., & Goodger, J. L. 2013, MNRAS, 435, 3353 [NASA ADS] [CrossRef] [Google Scholar]
- Harwood, J. J., Hardcastle, M. J., & Croston, J. H. 2015, MNRAS, 454, 3403 [NASA ADS] [CrossRef] [Google Scholar]
- Harwood, J. J., Croston, J. H., Intema, H. T., et al. 2016, MNRAS, 458, 4443 [NASA ADS] [CrossRef] [Google Scholar]
- Harwood, J. J., Hardcastle, M. J., Morganti, R., et al. 2017, MNRAS, 469, 639 [NASA ADS] [CrossRef] [Google Scholar]
- Heald, G., McKean, J., Pizzo, R., et al. 2010, Progress withthe LOFAR Imaging Pipeline, PoS(ISKAF2010)057 [Google Scholar]
- Hunik, D., & Jamrozy, M. 2016, ApJ, 817, L1 [NASA ADS] [CrossRef] [Google Scholar]
- Jaffe, W. J., & Perola, G. C. 1973, A&A, 26, 423 [NASA ADS] [Google Scholar]
- Jamrozy, M., Klein, U., Mack, K. H., Gregorini, L., & Parma, P. 2004, A&A, 427, 79 [NASA ADS] [CrossRef] [EDP Sciences] [Google Scholar]
- Labiano, A., García-Burillo, S., Combes, F., et al. 2013, A&A, 549, A58 [NASA ADS] [CrossRef] [EDP Sciences] [Google Scholar]
- Lara, L., Cotton, W. D., Feretti, L., et al. 2001, A&A, 370, 409 [NASA ADS] [CrossRef] [EDP Sciences] [Google Scholar]
- Leahy, J. P., & Williams, A. G. 1984, MNRAS, 210, 929 [NASA ADS] [CrossRef] [Google Scholar]
- Lonsdale, C. J., & Barthel, P. D. 1986, AJ, 92, 12 [NASA ADS] [CrossRef] [Google Scholar]
- Machalski, J., Kozieł-Wierzbowska, D., Jamrozy, M., & Saikia, D. J. 2008, ApJ, 679, 149 [NASA ADS] [CrossRef] [Google Scholar]
- Mack, K. H., Klein, U., O’Dea, C. P., & Willis, A. G. 1997, A&AS, 123, 423 [NASA ADS] [CrossRef] [EDP Sciences] [Google Scholar]
- Mack, K. H., Klein, U., O’Dea, C. P., Willis, A. G., & Saripalli, L. 1998, A&A, 329, 431 [NASA ADS] [Google Scholar]
- Malarecki, J. M., Staveley-Smith, L., Saripalli, L., et al. 2013, MNRAS, 432, 200 [NASA ADS] [CrossRef] [Google Scholar]
- Malarecki, J. M., Jones, D. H., Saripalli, L., Staveley-Smith, L., & Subrahmanyan, R. 2015, MNRAS, 449, 955 [NASA ADS] [CrossRef] [Google Scholar]
- Martel, A. R., Baum, S. A., Sparks, W. B., et al. 1999, ApJS, 122, 81 [NASA ADS] [CrossRef] [Google Scholar]
- McMullin, J. P., Waters, B., Schiebel, D., Young, W., & Golap, K. 2007, in Astronomical Data Analysis Software and Systems XVI, Proceedings of the Conference held 15–18 October 2006 in Tucson, Arizona, USA, eds. R. A. Shaw, F. Hill, & D. J. Bell, ASP Conf. Ser., 376, 127 [NASA ADS] [Google Scholar]
- McNamara, B. R., & Nulsen, P. E. J. 2007, ARA&A, 45, 117 [NASA ADS] [CrossRef] [MathSciNet] [Google Scholar]
- Miley, G. 1980, ARA&A, 18, 165 [Google Scholar]
- Morganti, R. 2017, Nat. Astron., 1, 596 [Google Scholar]
- Morganti, R., Tadhunter, C. N., & Oosterloo, T. A. 2005, A&A, 444, L9 [NASA ADS] [CrossRef] [EDP Sciences] [Google Scholar]
- O’Dea, C. P., Koekemoer, A. M., Baum, S. A., et al. 2001, AJ, 121, 1915 [NASA ADS] [CrossRef] [Google Scholar]
- Offringa, A. R., McKinley, B., Hurley-Walker, N., et al. 2014, MNRAS, 444, 606 [NASA ADS] [CrossRef] [Google Scholar]
- Orrù, E., van Velzen, S., Pizzo, R. F., et al. 2015, A&A, 584, A112 [NASA ADS] [CrossRef] [EDP Sciences] [Google Scholar]
- Pacholczyk, A. G. 1970, Radio Astrophysics. Nonthermal Processes in Galactic and Extragalactic Sources (San Francisco: Freeman) [Google Scholar]
- Planck Collaboration XIII. 2016, A&A, 594, A13 [NASA ADS] [CrossRef] [EDP Sciences] [Google Scholar]
- Pooley, G. G., & Henbest, S. N. 1974, MNRAS, 169, 477 [NASA ADS] [CrossRef] [Google Scholar]
- Saikia, D. J., & Jamrozy, M. 2009, Bull. Astron. Soc. India, 37, 63 [NASA ADS] [Google Scholar]
- Saripalli, L., & Roberts, D. H. 2018, ApJ, 852, 48 [NASA ADS] [CrossRef] [Google Scholar]
- Saripalli, L., Subrahmanyan, R., Thorat, K., et al. 2012, ApJS, 199, 27 [NASA ADS] [CrossRef] [Google Scholar]
- Scaife, A. M. M., & Heald, G. H. 2012, MNRAS, 423, 30 [Google Scholar]
- Schilizzi, R. T., Tian, W. W., Conway, J. E., et al. 2001, A&A, 368, 398 [NASA ADS] [CrossRef] [EDP Sciences] [Google Scholar]
- Schoenmakers, A. P., de Bruyn, A. G., Rottgering, H. J. A., & van der Laan, H. 1999, A&A, 341, 44 [NASA ADS] [Google Scholar]
- Schoenmakers, A. P., de Bruyn, A. G., Röttgering, H. J. A., & van der Laan, H. 2001, A&A, 374, 861 [NASA ADS] [CrossRef] [EDP Sciences] [Google Scholar]
- Schulz, R., Morganti, R., Nyland, K., et al. 2018, A&A, 617, A38 [NASA ADS] [CrossRef] [EDP Sciences] [Google Scholar]
- Shimwell, T. W., Röttgering, H. J. A., Best, P. N., et al. 2017, A&A, 598, A104 [NASA ADS] [CrossRef] [EDP Sciences] [Google Scholar]
- Shimwell, T. W., Tasse, C., Hardcastle, M. J., et al. 2019, A&A, 622, A1 [NASA ADS] [CrossRef] [EDP Sciences] [Google Scholar]
- Strom, R. G., Baker, J. R., & Willis, A. G. 1981, A&A, 100, 220 [NASA ADS] [Google Scholar]
- Struve, C., & Conway, J. E. 2012, A&A, 546, A22 [NASA ADS] [CrossRef] [EDP Sciences] [Google Scholar]
- Tremblay, G. R., O’Dea, C. P., Baum, S. A., et al. 2010, ApJ, 715, 172 [NASA ADS] [CrossRef] [Google Scholar]
- Valtaoja, E. 1984, A&A, 140, 148 [NASA ADS] [Google Scholar]
- van Gorkom, J. H., Knapp, G. R., Ekers, R. D., et al. 1989, AJ, 97, 708 [NASA ADS] [CrossRef] [Google Scholar]
- van Haarlem, M. P., Wise, M. W., Gunst, A. W., et al. 2013, A&A, 556, A2 [NASA ADS] [CrossRef] [EDP Sciences] [Google Scholar]
- Willis, A. G., Strom, R. G., & Wilson, A. S. 1974, Nature, 250, 625 [NASA ADS] [CrossRef] [Google Scholar]
- Wright, E. L. 2006, PASP, 118, 1711 [NASA ADS] [CrossRef] [Google Scholar]
All Tables
All Figures
|
Fig. 1. UV coverage (left) and its radially averaged profile of the LOFAR data. |
| In the text | |
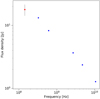 |
Fig. 2. Integrated flux density of 3C 236. |
| In the text | |
|
Fig. 3. LOFAR intensity map (linear scale, level limits at 1 and 150 mJy beam−1) of 3C 236 at 143.6 MHz. Fifteen positive contours are overlaid as solid grey lines with levels at |
| In the text | |
|
Fig. 4.
|
| In the text | |
|
Fig. 5. Spectral index error (top panel) and spectral index profiles along the paths shown in Fig. 4. The profile paths start in the inner part of the lobes. The shaded area in the spectral profile plots represents the spectral index error. |
| In the text | |
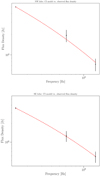 |
Fig. 6. CI model fits as reported in the lower section of Table 4. |
| In the text | |
Current usage metrics show cumulative count of Article Views (full-text article views including HTML views, PDF and ePub downloads, according to the available data) and Abstracts Views on Vision4Press platform.
Data correspond to usage on the plateform after 2015. The current usage metrics is available 48-96 hours after online publication and is updated daily on week days.
Initial download of the metrics may take a while.