Fig. 4.
![]() spectral index map. The restoring beam size is 50″ (bottom left). Overlaid in black are contours tracing the emission from the convolved LOFAR image (listed in Table 2) with levels at
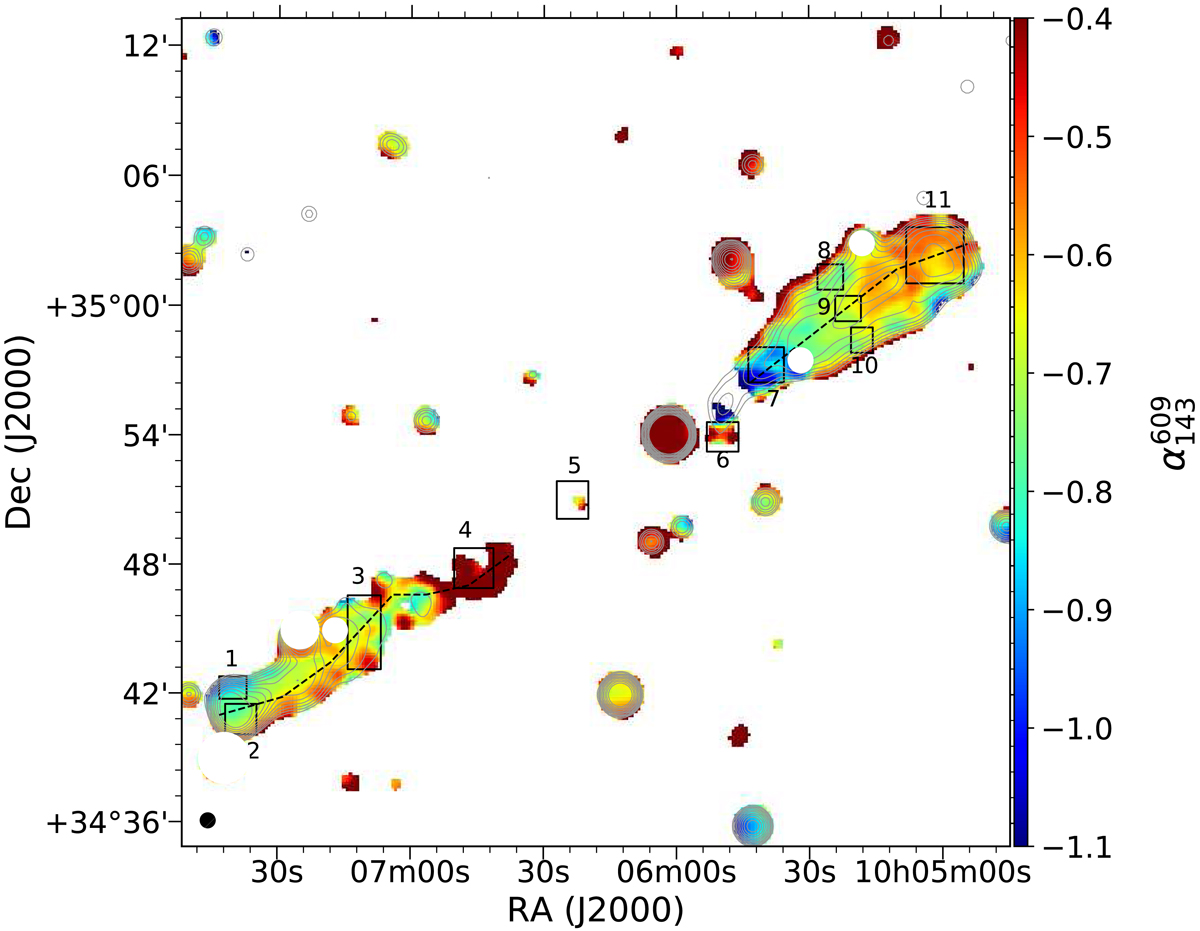
spectral index map. The restoring beam size is 50″ (bottom left). Overlaid in black are contours tracing the emission from the convolved LOFAR image (listed in Table 2) with levels at ![]() , where n = [0, 9] and σ = 3 mJy beam−1. Inset are enlarged views of the lobes. Profile paths along which the spectral index values shown in Fig. 5 are measured are shown using dashed lines, as well as measurement regions of the spectral index values listed in Table 4 (solid labelled rectangles). Point sources embedded in the lobes have been masked.
, where n = [0, 9] and σ = 3 mJy beam−1. Inset are enlarged views of the lobes. Profile paths along which the spectral index values shown in Fig. 5 are measured are shown using dashed lines, as well as measurement regions of the spectral index values listed in Table 4 (solid labelled rectangles). Point sources embedded in the lobes have been masked.
Current usage metrics show cumulative count of Article Views (full-text article views including HTML views, PDF and ePub downloads, according to the available data) and Abstracts Views on Vision4Press platform.
Data correspond to usage on the plateform after 2015. The current usage metrics is available 48-96 hours after online publication and is updated daily on week days.
Initial download of the metrics may take a while.