Fig. 3.
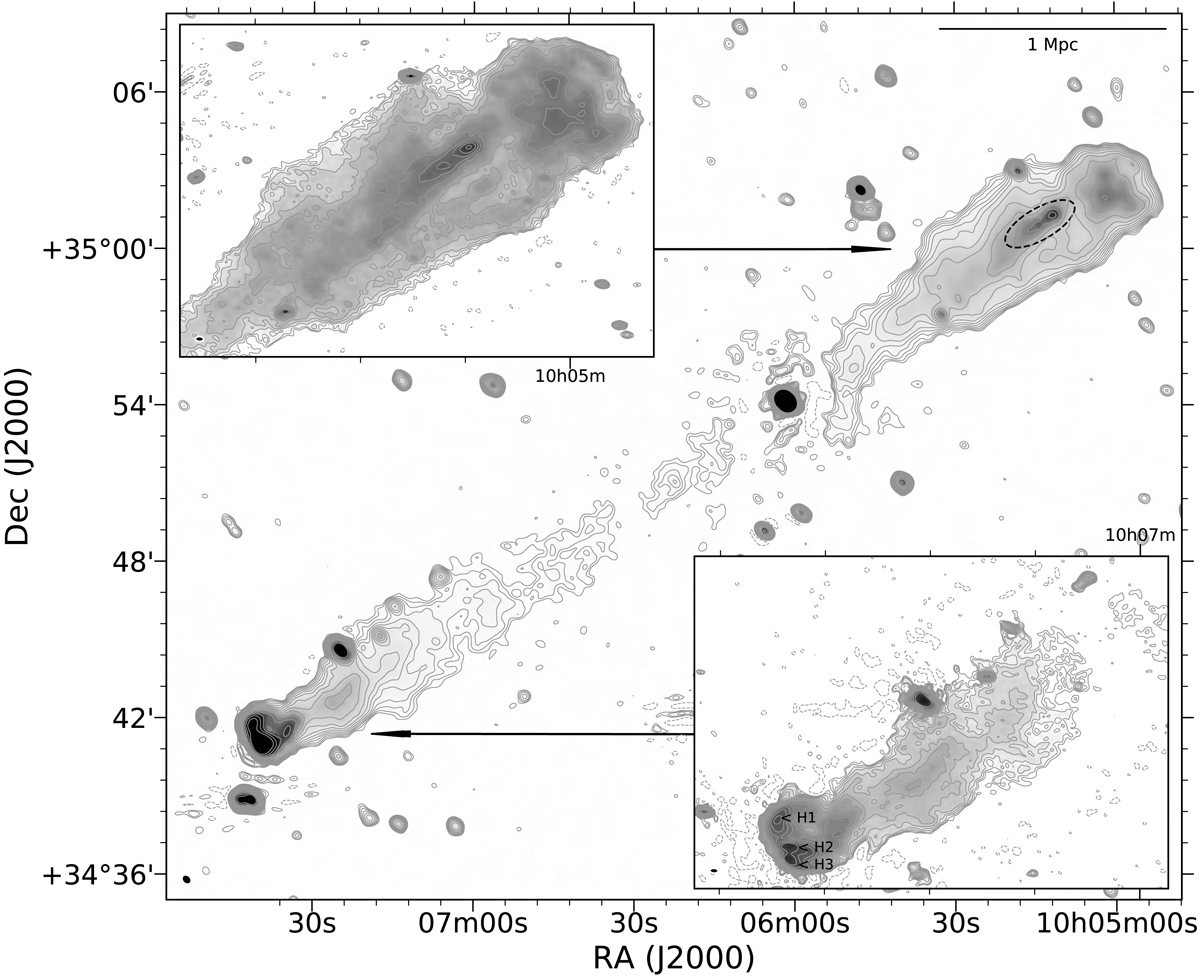
LOFAR intensity map (linear scale, level limits at 1 and 150 mJy beam−1) of 3C 236 at 143.6 MHz. Fifteen positive contours are overlaid as solid grey lines with levels at ![]() , where σ = 0.6 mJy beam−1, and n increasing from 0 to 14 in increments of 1. One negative contour level at −3σ is overlaid as a dashed grey line. The restoring beam size of 23.81″ × 19.18″ is shown in the lower left corner. High resolution image insets (logarithmic intensity scale, limits at 1, 100 and 500 mJy beam−1, 11.77″ × 6.82″ restoring beam, σ = 0.26 mJy beam−1) of the NW and SE lobes are shown in the top-left and bottom-right corners respectively. Regions of interest are marked with a dashed ellipse and labelled.
, where σ = 0.6 mJy beam−1, and n increasing from 0 to 14 in increments of 1. One negative contour level at −3σ is overlaid as a dashed grey line. The restoring beam size of 23.81″ × 19.18″ is shown in the lower left corner. High resolution image insets (logarithmic intensity scale, limits at 1, 100 and 500 mJy beam−1, 11.77″ × 6.82″ restoring beam, σ = 0.26 mJy beam−1) of the NW and SE lobes are shown in the top-left and bottom-right corners respectively. Regions of interest are marked with a dashed ellipse and labelled.
Current usage metrics show cumulative count of Article Views (full-text article views including HTML views, PDF and ePub downloads, according to the available data) and Abstracts Views on Vision4Press platform.
Data correspond to usage on the plateform after 2015. The current usage metrics is available 48-96 hours after online publication and is updated daily on week days.
Initial download of the metrics may take a while.