Fig. 9.
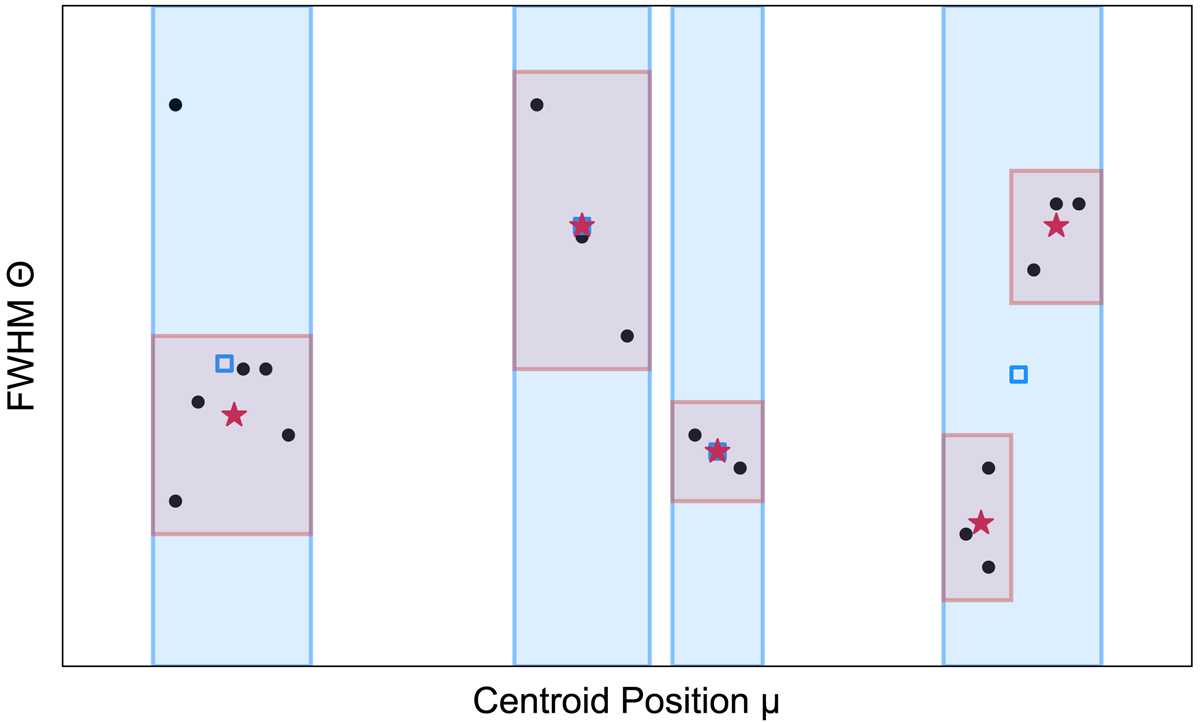
Illustration of the grouping routine. Black points indicate centroid (μ) and FWHM (Θ) values of Gaussian components from the best fit solutions of unflagged neighbouring spectra. Blue shaded areas indicate the results of the first grouping, in which data points are only separated according to their μ values. Red shaded areas mark the results of the second grouping in which data points are additionally separated according to their Θ values. Blue squares and red stars indicate the initial guesses for the refitting with the first and second grouping approach, respectively.
Current usage metrics show cumulative count of Article Views (full-text article views including HTML views, PDF and ePub downloads, according to the available data) and Abstracts Views on Vision4Press platform.
Data correspond to usage on the plateform after 2015. The current usage metrics is available 48-96 hours after online publication and is updated daily on week days.
Initial download of the metrics may take a while.