Fig. 6.
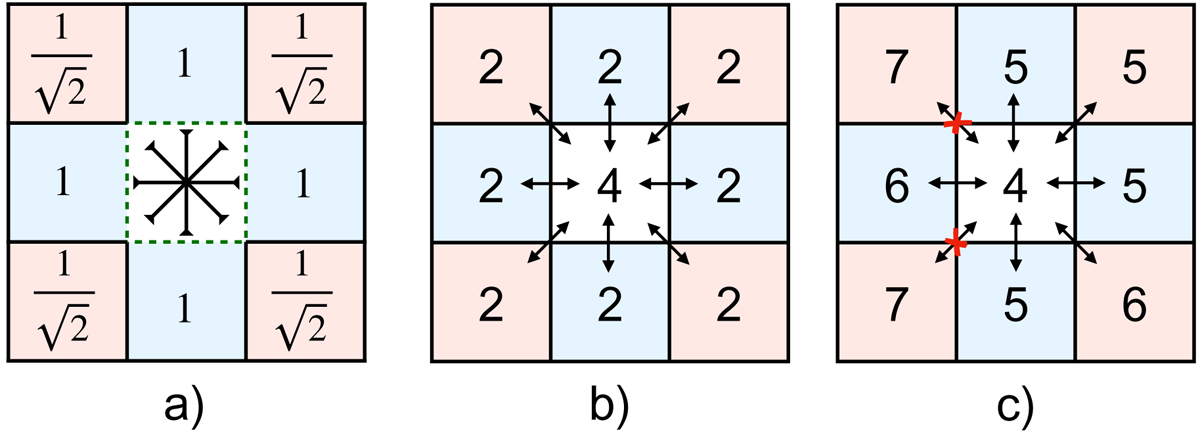
Illustration of the flagging of spectra based on their number of components with the default settings of our algorithm. Each 3 × 3 square shows the central spectrum (in white) and the surrounding immediate neighbours coloured according to their weights. Panel a: Weights we apply to each neighbouring fit solution to calculate their weighted median. Panels b and c: Two cases where the fitted number of components of the central spectrum would be flagged as incompatible with the fitted number of components of their neighbours. See Sect. 3.2.2 for more details.
Current usage metrics show cumulative count of Article Views (full-text article views including HTML views, PDF and ePub downloads, according to the available data) and Abstracts Views on Vision4Press platform.
Data correspond to usage on the plateform after 2015. The current usage metrics is available 48-96 hours after online publication and is updated daily on week days.
Initial download of the metrics may take a while.