Fig. E.1.
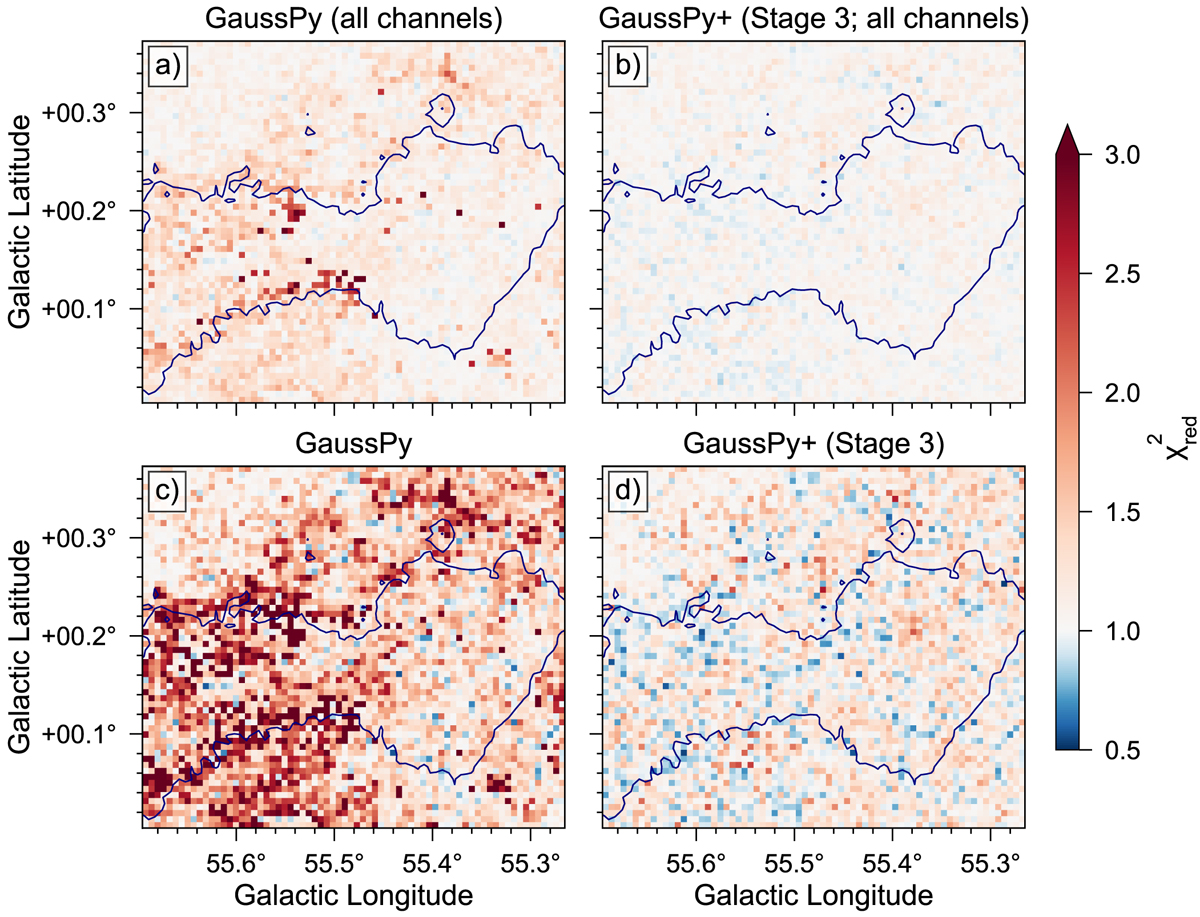
Maps showing the ![]() values for the GAUSSPY (left panels) and stage 3 of the GAUSSPY+ (right panels) decomposition results, calculated by using either all available spectral channels (upper panels) or restricted to the spectral channels estimated to contain signal. All panels are overplotted with the contour from panel b in Fig. 13. Panels c and d are identical to panelsi and l in Fig. 16.
values for the GAUSSPY (left panels) and stage 3 of the GAUSSPY+ (right panels) decomposition results, calculated by using either all available spectral channels (upper panels) or restricted to the spectral channels estimated to contain signal. All panels are overplotted with the contour from panel b in Fig. 13. Panels c and d are identical to panelsi and l in Fig. 16.
Current usage metrics show cumulative count of Article Views (full-text article views including HTML views, PDF and ePub downloads, according to the available data) and Abstracts Views on Vision4Press platform.
Data correspond to usage on the plateform after 2015. The current usage metrics is available 48-96 hours after online publication and is updated daily on week days.
Initial download of the metrics may take a while.