Fig. D.1.
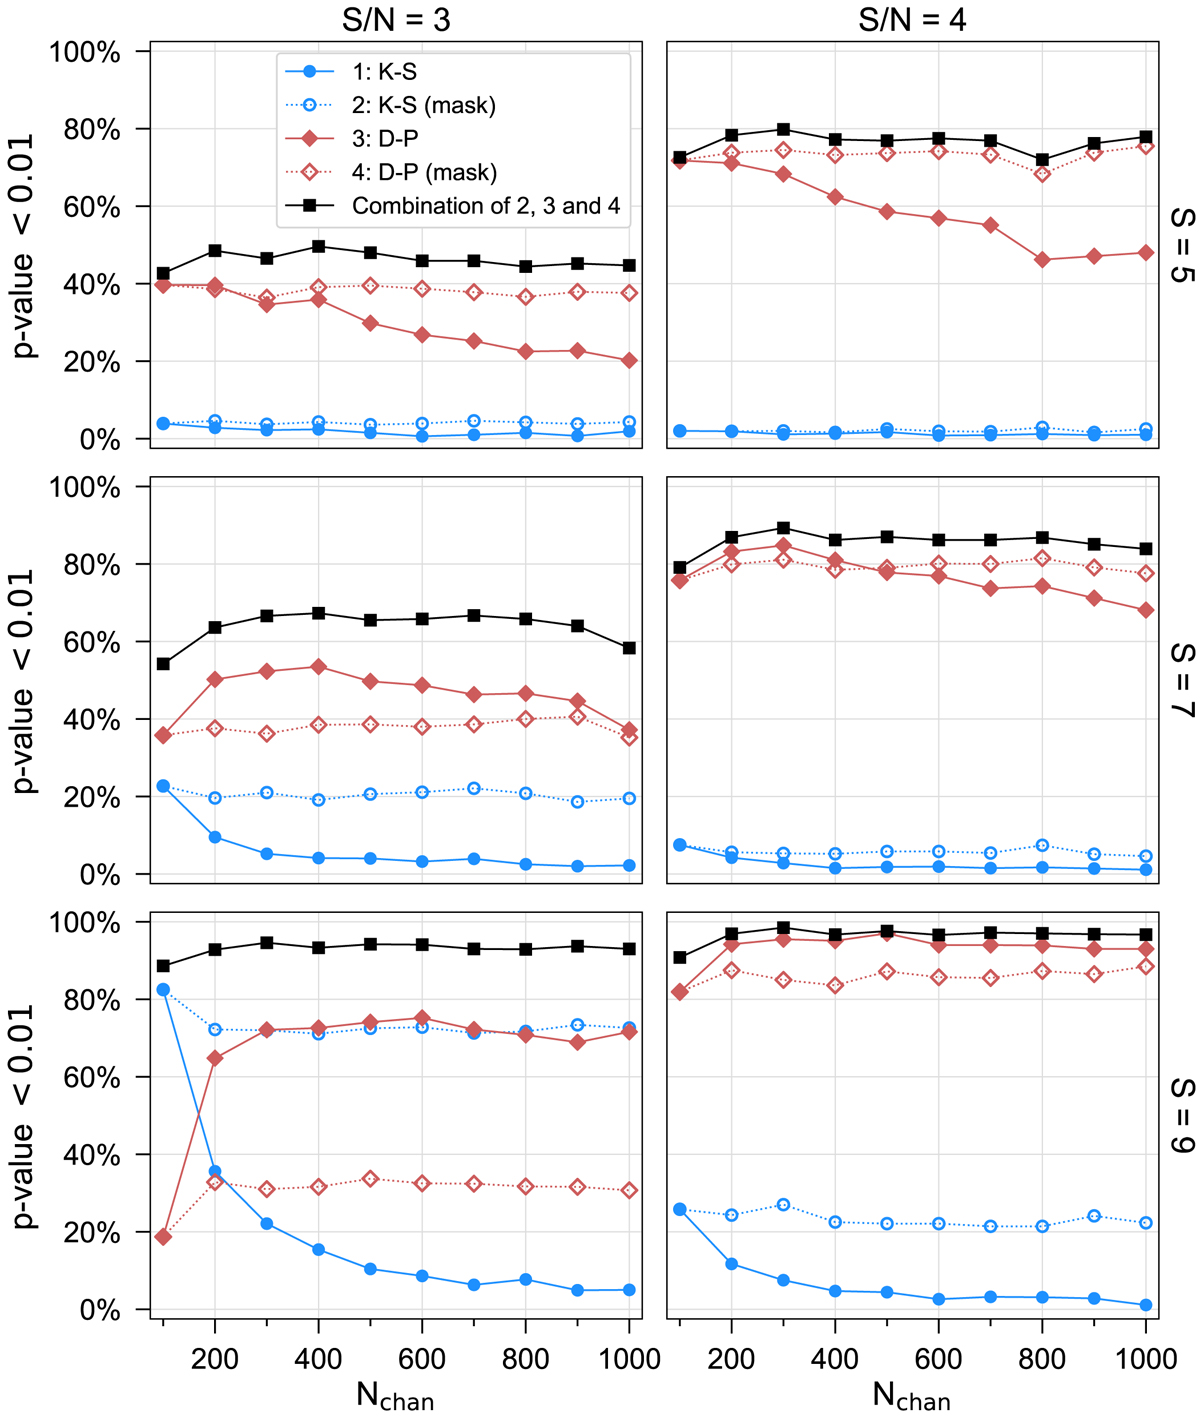
Comparison of the performance of different normality tests for mock residuals as a function of the number of spectral channels. The residuals contain a single Gaussian signal component with a signal-to-noise ratio of 3 or 4 (left and right panels, respectively) and significance values of 5, 7, and 9 (upper, middle, and lower panels, respectively). See Appendix D for more details.
Current usage metrics show cumulative count of Article Views (full-text article views including HTML views, PDF and ePub downloads, according to the available data) and Abstracts Views on Vision4Press platform.
Data correspond to usage on the plateform after 2015. The current usage metrics is available 48-96 hours after online publication and is updated daily on week days.
Initial download of the metrics may take a while.