Fig. B.8.
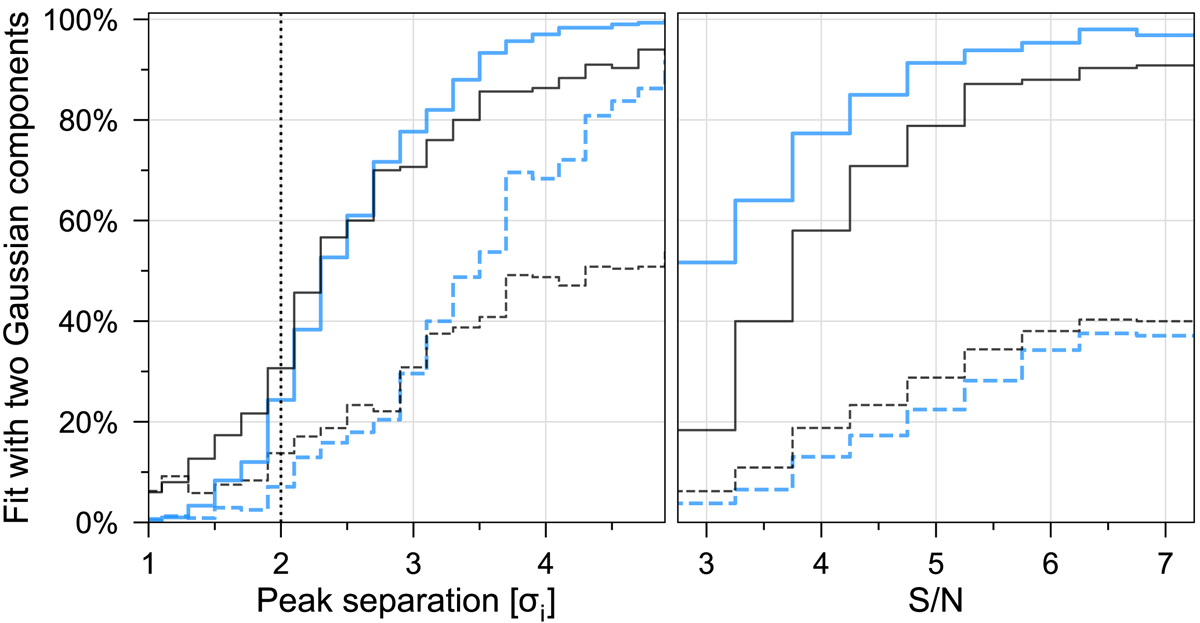
Decomposition results of a sample of synthetic spectra with two identical Gaussian components, whose S/N, peak separation and FWHM parameter were varied. Blue and black lines indicate the results obtained for the decomposition runs with GAUSSPY+ and GAUSSPY, respectively. Left: Percentage of fitted spectra with two Gaussian components as a function of peak separation for S/N < 5 (dashed lines) and ≥5 (solid lines). The dotted vertical line indicates the separation threshold for two identical Gaussian components without noise. Right: Percentage of fitted spectra with two Gaussian components as a function of their S/N for peak separations of < 3 × σi (dashed lines) and ≥3 × σi (solid lines).
Current usage metrics show cumulative count of Article Views (full-text article views including HTML views, PDF and ePub downloads, according to the available data) and Abstracts Views on Vision4Press platform.
Data correspond to usage on the plateform after 2015. The current usage metrics is available 48-96 hours after online publication and is updated daily on week days.
Initial download of the metrics may take a while.