Fig. B.7.
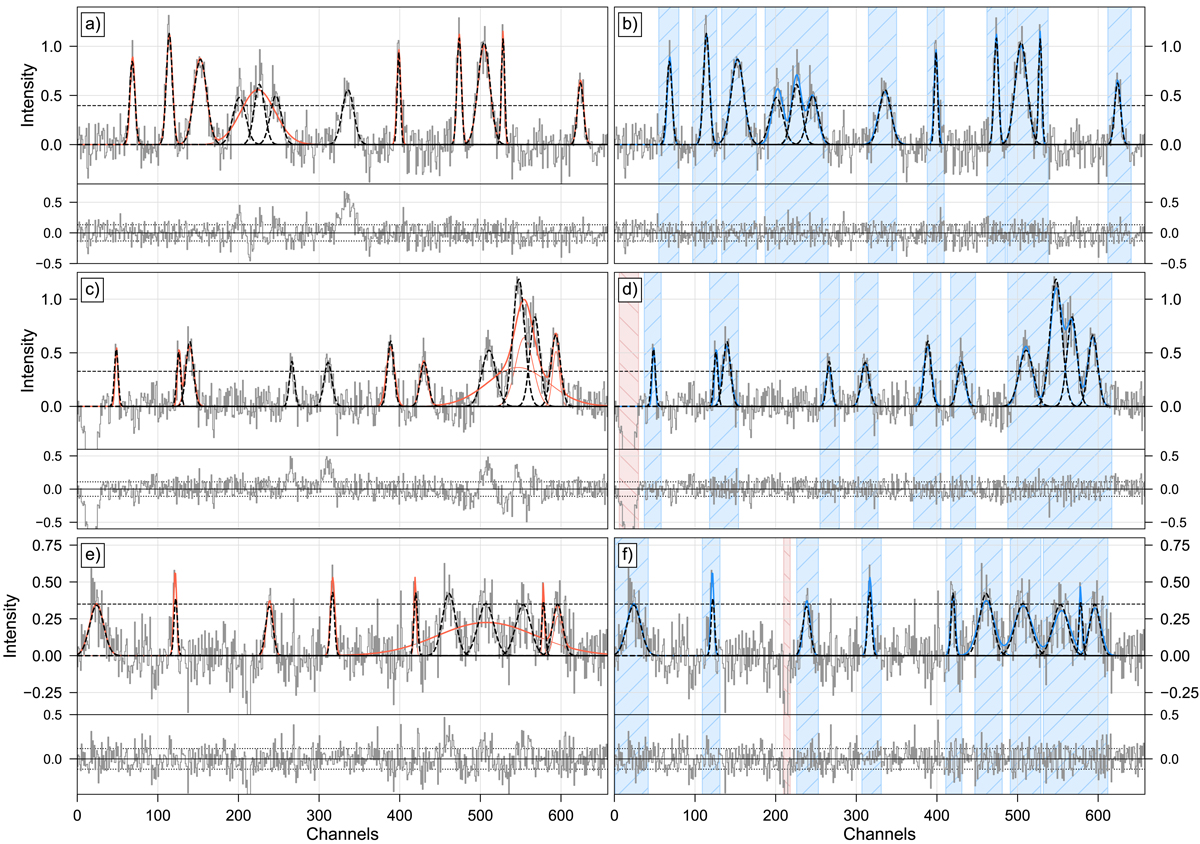
Example spectra illustrating the better performance of the improved fitting routine of GAUSSPY+ (Sect. 3.2.3) compared to the original GAUSSPY algorithm. Upper (a, b), middle (c, d), and lower (e, f) panels: synthetic spectra from samples B, C, and D, respectively. The panels on the left (a, c, e) show the decomposition results obtained with the original GAUSSPY algorithm and panels on the right (b, d, f) show the corresponding decomposition results from the improved fitting routine of GAUSSPY+. The correct individual Gaussian components are indicated in dashed black lines; individual Gaussian components and their combined intensity from the decomposition run with GAUSSPY and GAUSSPY+ are indicated in solid red and blue lines, respectively. The smaller panels below the spectrum show the corresponding residual with the dotted black lines indicating values of ±σrms. Dashed black lines indicate a S/N of 3. Blue and red shaded areas show the automatically identified signal and noise spike intervals, respectively.
Current usage metrics show cumulative count of Article Views (full-text article views including HTML views, PDF and ePub downloads, according to the available data) and Abstracts Views on Vision4Press platform.
Data correspond to usage on the plateform after 2015. The current usage metrics is available 48-96 hours after online publication and is updated daily on week days.
Initial download of the metrics may take a while.