Fig. B.5.
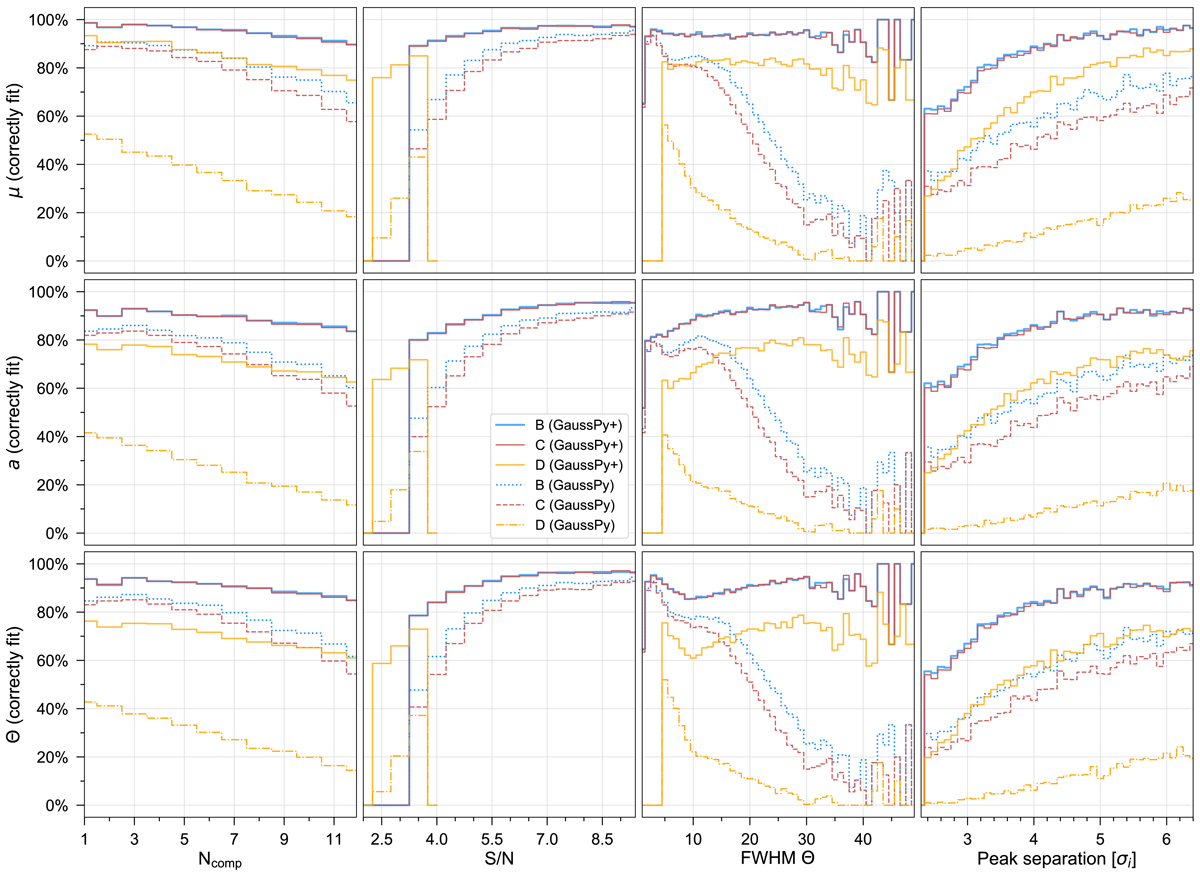
Performance of the GAUSSPY and GAUSSPY+ decomposition runs for samples of synthetic spectra. The ordinate in the upper, middle, and lower panels show the fraction of correctly fit Gaussian mean positions, amplitude values, and FWHM values, respectively, plotted against the number of true Gaussian components, the S/N, the true FWHM values, and the peak separation in the left, centre left, centre right, and right panels, respectively. See Appendix B.6 for more details.
Current usage metrics show cumulative count of Article Views (full-text article views including HTML views, PDF and ePub downloads, according to the available data) and Abstracts Views on Vision4Press platform.
Data correspond to usage on the plateform after 2015. The current usage metrics is available 48-96 hours after online publication and is updated daily on week days.
Initial download of the metrics may take a while.