Fig. B.3.
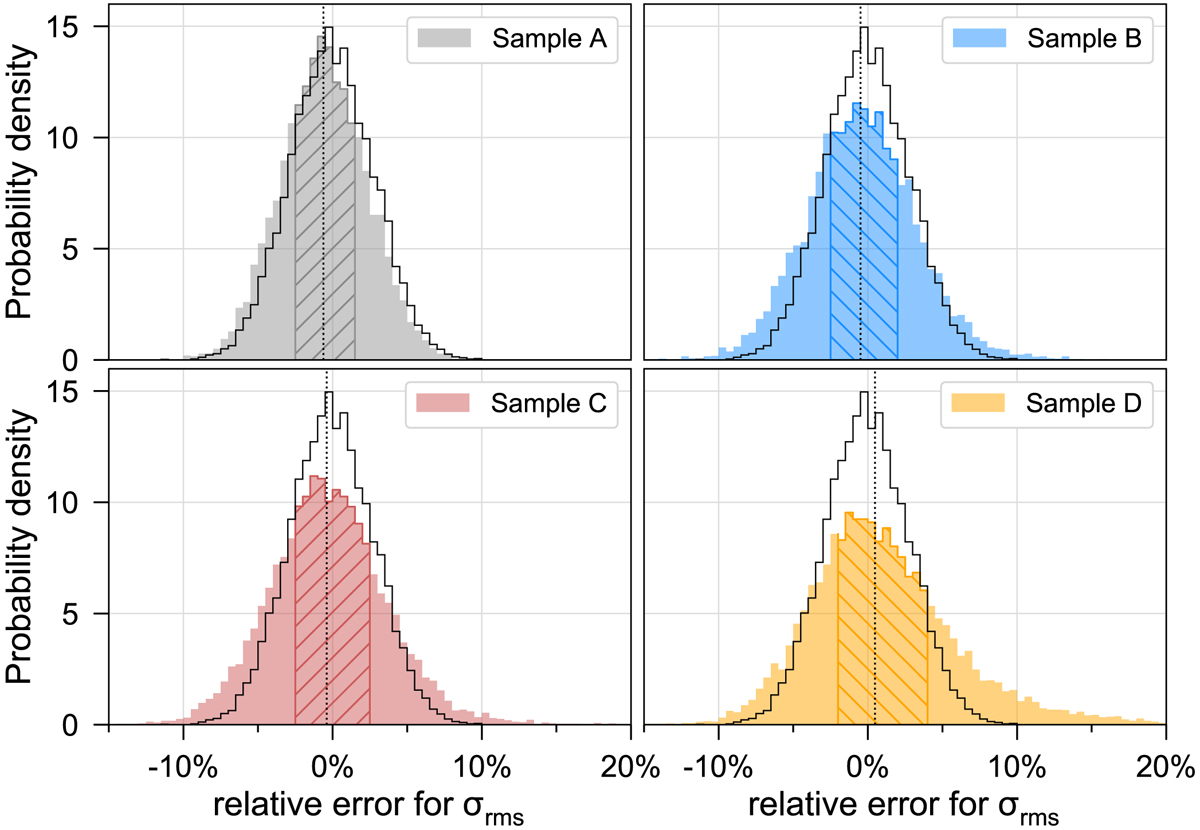
Probability density distributions showing the results of our automated noise estimation for the sample of synthetic spectra containing: only white noise (upper left panel); white noise and signal (upper right panel); white noise, signal, and negative noise spikes (lower left panel); white noise, weak signal, and negative noise spikes (lower right panel). The abscissa shows the determined root-mean-square noise value σrms normalised by the true root-mean-square noise value σrms, true that was used to generate the white noise. Hatched areas and vertical dotted lines show the respective interquartile ranges and median value of the respective distributions. The black solid line shows the distribution obtained by using all spectral channels from sample A for the noise calculation. See Appendix B.2 for more details.
Current usage metrics show cumulative count of Article Views (full-text article views including HTML views, PDF and ePub downloads, according to the available data) and Abstracts Views on Vision4Press platform.
Data correspond to usage on the plateform after 2015. The current usage metrics is available 48-96 hours after online publication and is updated daily on week days.
Initial download of the metrics may take a while.