Fig. B.1.
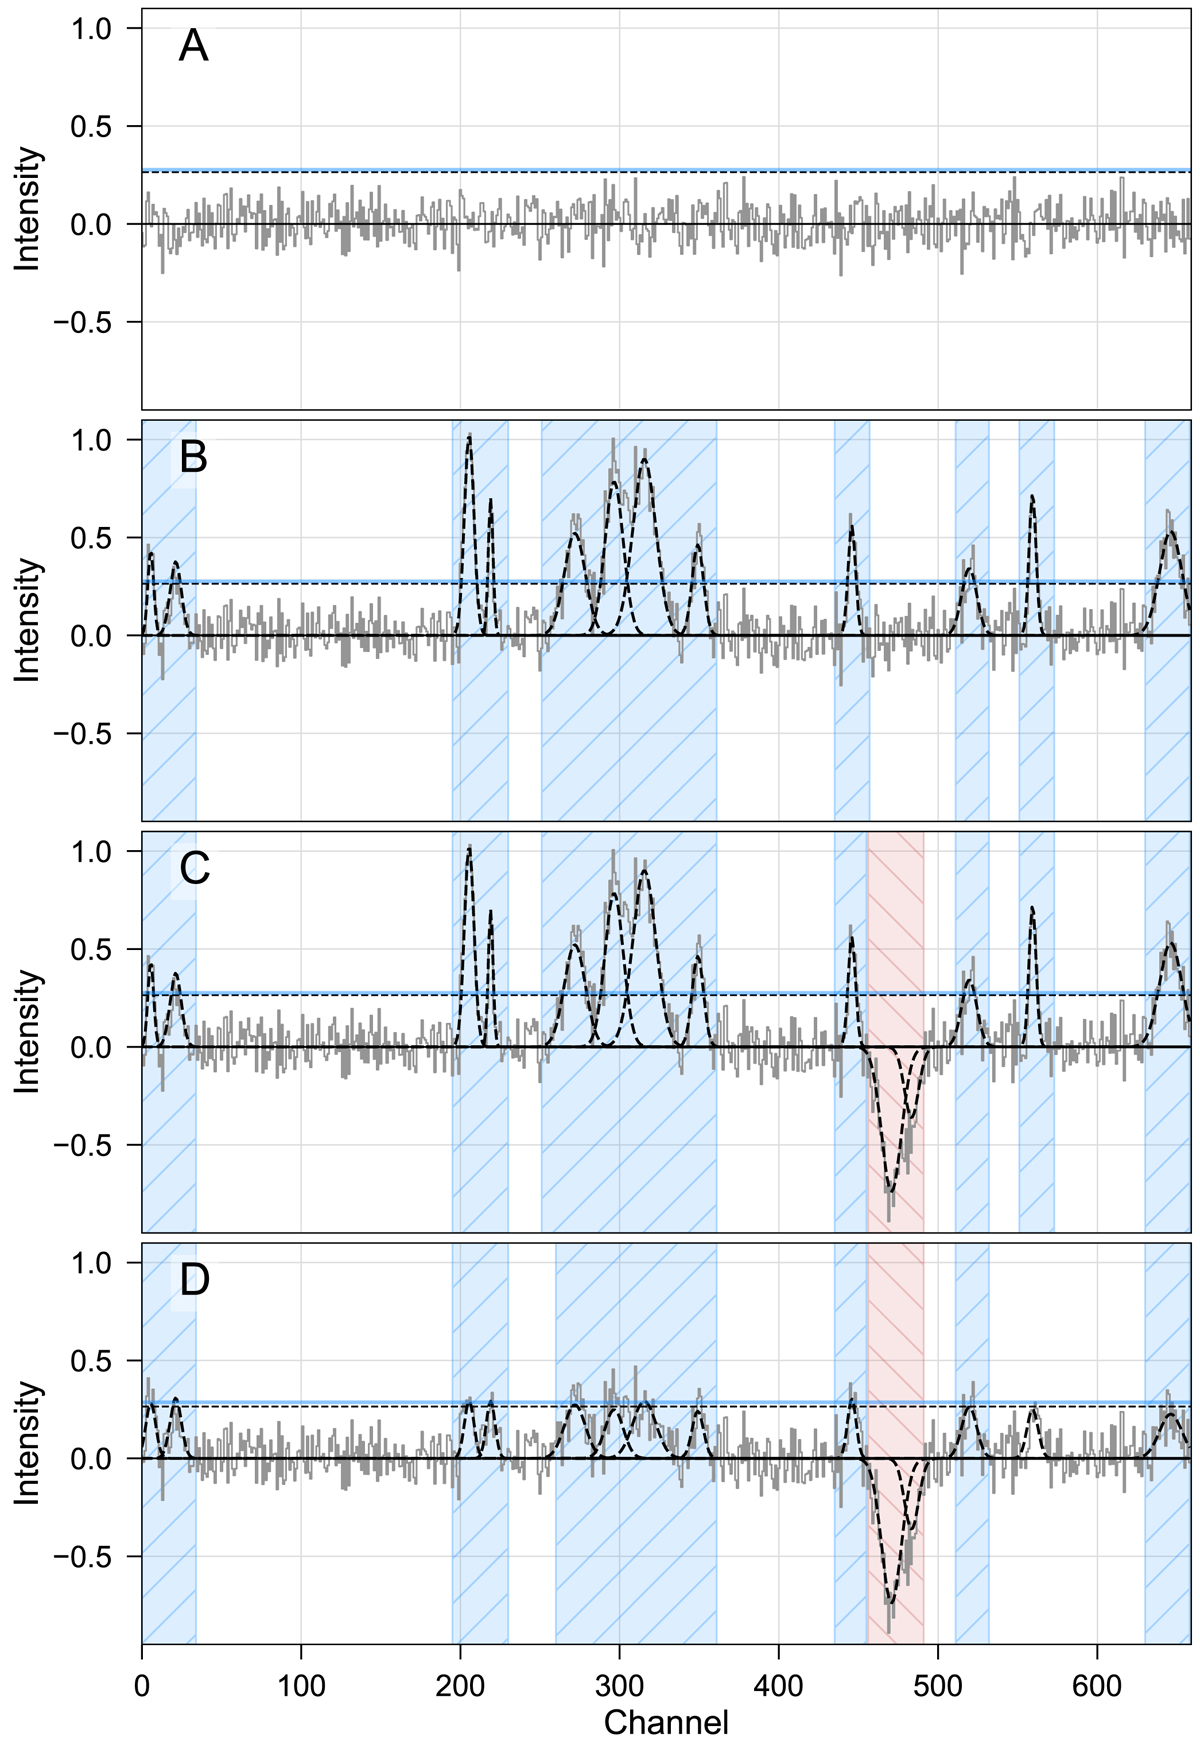
Example spectra from the four samples of synthetic spectra (A–D) used to test the performance of GAUSSPY+. Black dotted lines indicate individual Gaussian components of the signal and negative noise spikes. The horizontal dashed black lines show a S/N threshold of 3. Shaded areas indicate intervals that GAUSSPY+ classified as signal intervals (blue) and noise spikes (red). The noise is the same in all four panels.
Current usage metrics show cumulative count of Article Views (full-text article views including HTML views, PDF and ePub downloads, according to the available data) and Abstracts Views on Vision4Press platform.
Data correspond to usage on the plateform after 2015. The current usage metrics is available 48-96 hours after online publication and is updated daily on week days.
Initial download of the metrics may take a while.