Fig. 2.
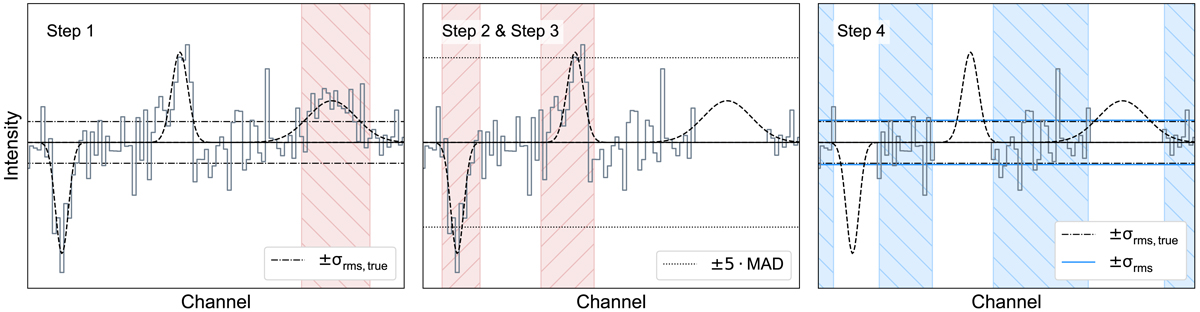
Illustration of our automated noise estimation routine for a mock spectrum containing two signal peaks and a negative noise spike. Hatched red areas indicate spectral channels that are masked out and hatched blue areas indicate all remaining spectral channels used in the noise calculation. Right panel: Comparison of the true noise value (σrms, true; black dash-dotted lines) with the noise value estimated by our automated routine (σrms, blue solid lines). See Sect. 3.1.1 for more details.
Current usage metrics show cumulative count of Article Views (full-text article views including HTML views, PDF and ePub downloads, according to the available data) and Abstracts Views on Vision4Press platform.
Data correspond to usage on the plateform after 2015. The current usage metrics is available 48-96 hours after online publication and is updated daily on week days.
Initial download of the metrics may take a while.