Fig. 18.
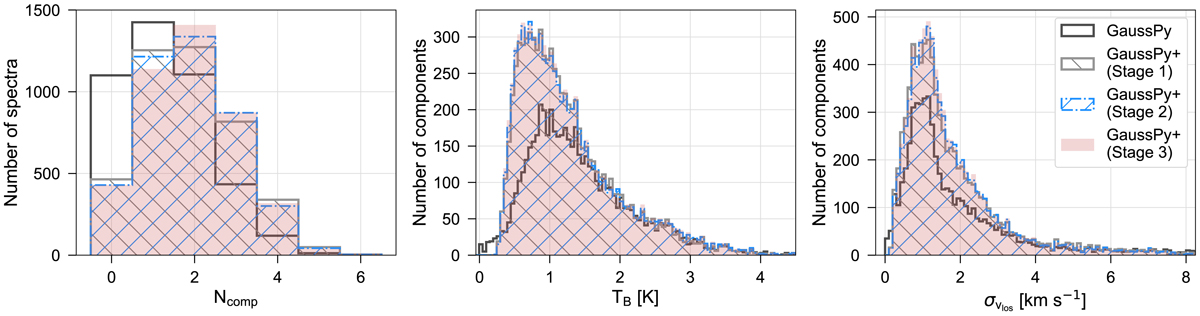
Distribution of fit parameters for the decomposition results of the GRS test field with GAUSSPY and the three stages of GAUSSPY+. Left: Histogram of the number of fitted components per spectrum. Middle: Histogram of the amplitude values TB of all Gaussian fit components. The bin size is 0.05 K. Right: Histogram of the velocity dispersion values σvlos of all Gaussian fit components. The bin size is 0.1 km s−1.
Current usage metrics show cumulative count of Article Views (full-text article views including HTML views, PDF and ePub downloads, according to the available data) and Abstracts Views on Vision4Press platform.
Data correspond to usage on the plateform after 2015. The current usage metrics is available 48-96 hours after online publication and is updated daily on week days.
Initial download of the metrics may take a while.