Fig. 17.
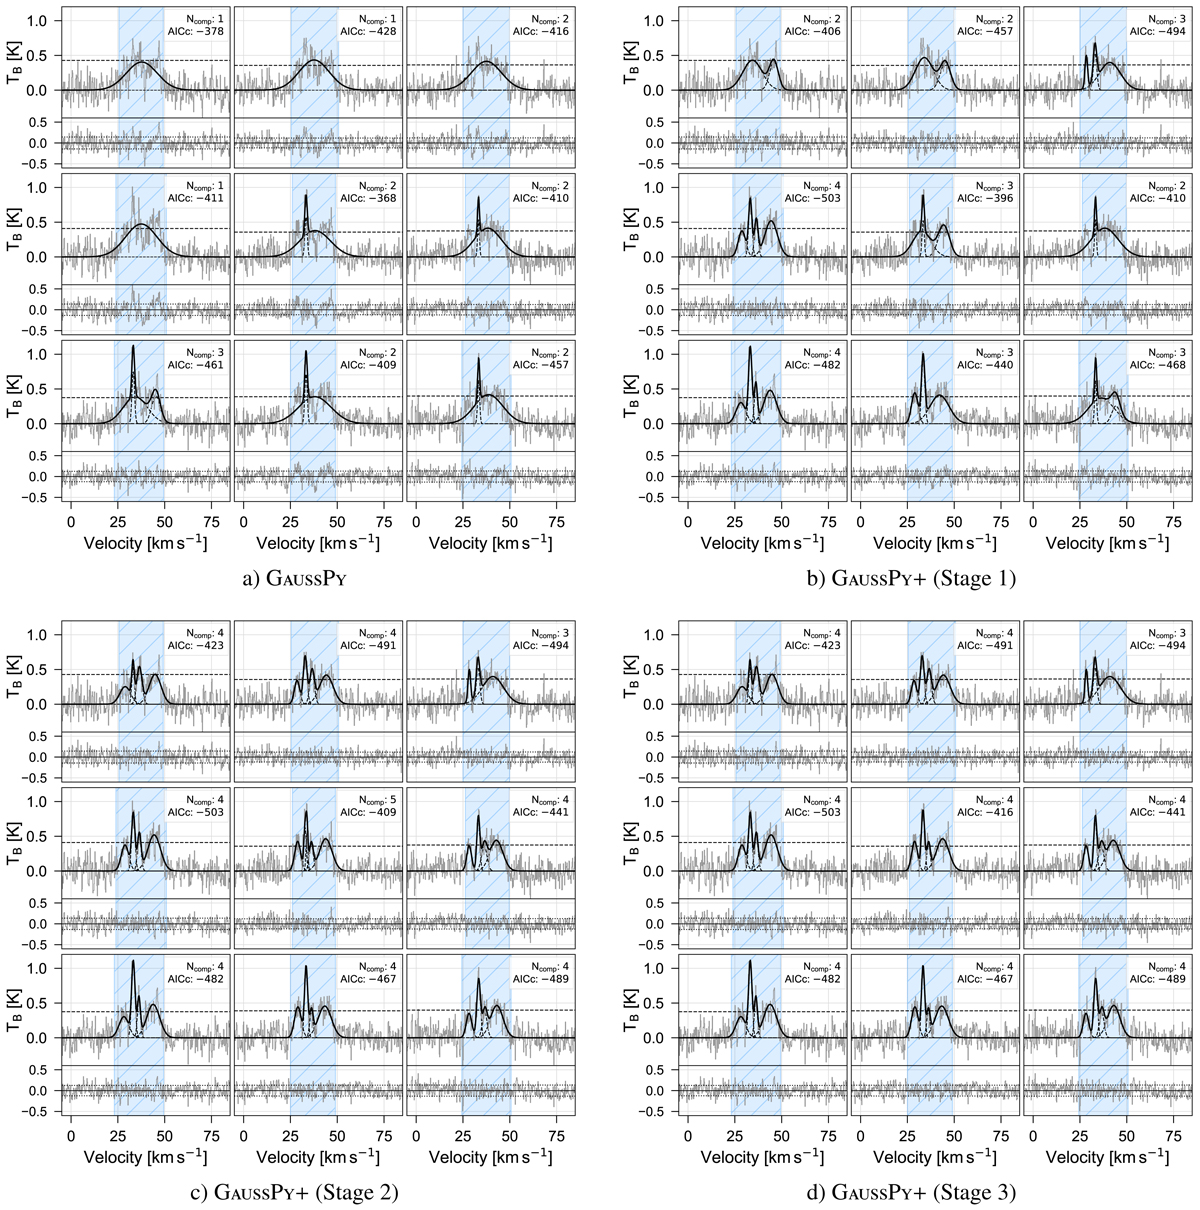
Fitting results of nine neighbouring spectra in the GRS test field for the decomposition with GAUSSPY (a) and after Stage 1–3 of GAUSSPY+ (b–d, respectively). Individual fit components and their combination are shown in dashed and solid black lines, respectively. Horizontal dashed black lines mark a S/N threshold of 3 and blue shaded areas indicate the identified signal intervals. The number of used fit components Ncomp and the resulting AICc values are noted in the upper right corner of the main panel. The smaller subpanels show the residual with the horizontal dotted black lines marking values of ±σrms.
Current usage metrics show cumulative count of Article Views (full-text article views including HTML views, PDF and ePub downloads, according to the available data) and Abstracts Views on Vision4Press platform.
Data correspond to usage on the plateform after 2015. The current usage metrics is available 48-96 hours after online publication and is updated daily on week days.
Initial download of the metrics may take a while.