Fig. 16.
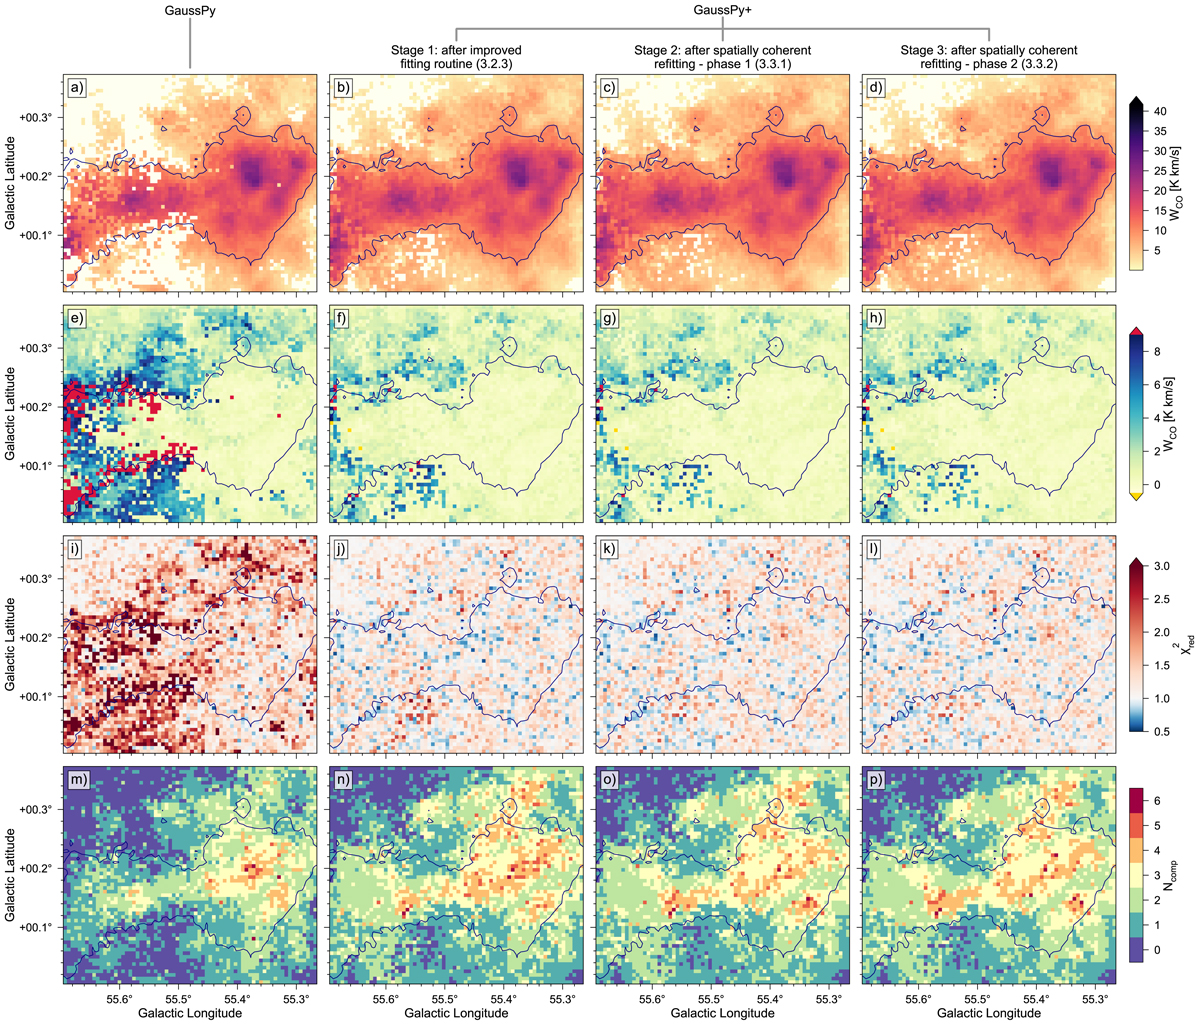
From left to right: Decomposition results for the original GAUSSPY algorithm and three stages of GAUSSPY+ (improved fitting routine, phase 1 and 2 of the spatially coherent refitting). From top to bottom: Zeroth moment maps of the decomposition results; residual maps obtained by comparing the zeroth moment maps of the decomposition with panel b in Fig. 13; maps showing the ![]() values for the fit, with the goodness of fit calculation restricted to the channels estimated to contain signal (see Sect. 3.1.2); and maps of the number of Gaussian fit components per spectrum. All panels are overplotted with the contour from panel b in Fig. 13. The GAUSSPY+ decompositions show a clear trend towards more spatial coherence and an improvement in the quality of the fits for the regions with lower emission or higher noise levels.
values for the fit, with the goodness of fit calculation restricted to the channels estimated to contain signal (see Sect. 3.1.2); and maps of the number of Gaussian fit components per spectrum. All panels are overplotted with the contour from panel b in Fig. 13. The GAUSSPY+ decompositions show a clear trend towards more spatial coherence and an improvement in the quality of the fits for the regions with lower emission or higher noise levels.
Current usage metrics show cumulative count of Article Views (full-text article views including HTML views, PDF and ePub downloads, according to the available data) and Abstracts Views on Vision4Press platform.
Data correspond to usage on the plateform after 2015. The current usage metrics is available 48-96 hours after online publication and is updated daily on week days.
Initial download of the metrics may take a while.