Fig. 15.
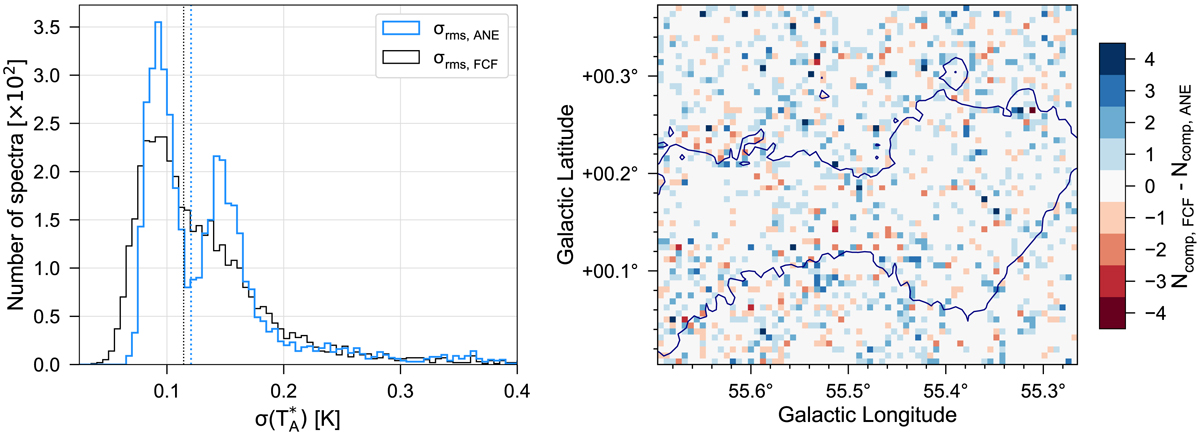
Left: Histogram of the σrms values shown in Fig. 14 for the automated noise estimation of GAUSSPY+ (ANE, blue) and the fixed channel fraction approach (FCF, black). The dotted vertical lines show the corresponding median values of the two distributions. Right: Map showing the difference in the number of fitted components for the automated noise estimation (Ncomp, ANE) and the fixed channel fraction approach (Ncomp, FCF).
Current usage metrics show cumulative count of Article Views (full-text article views including HTML views, PDF and ePub downloads, according to the available data) and Abstracts Views on Vision4Press platform.
Data correspond to usage on the plateform after 2015. The current usage metrics is available 48-96 hours after online publication and is updated daily on week days.
Initial download of the metrics may take a while.