Fig. 12.
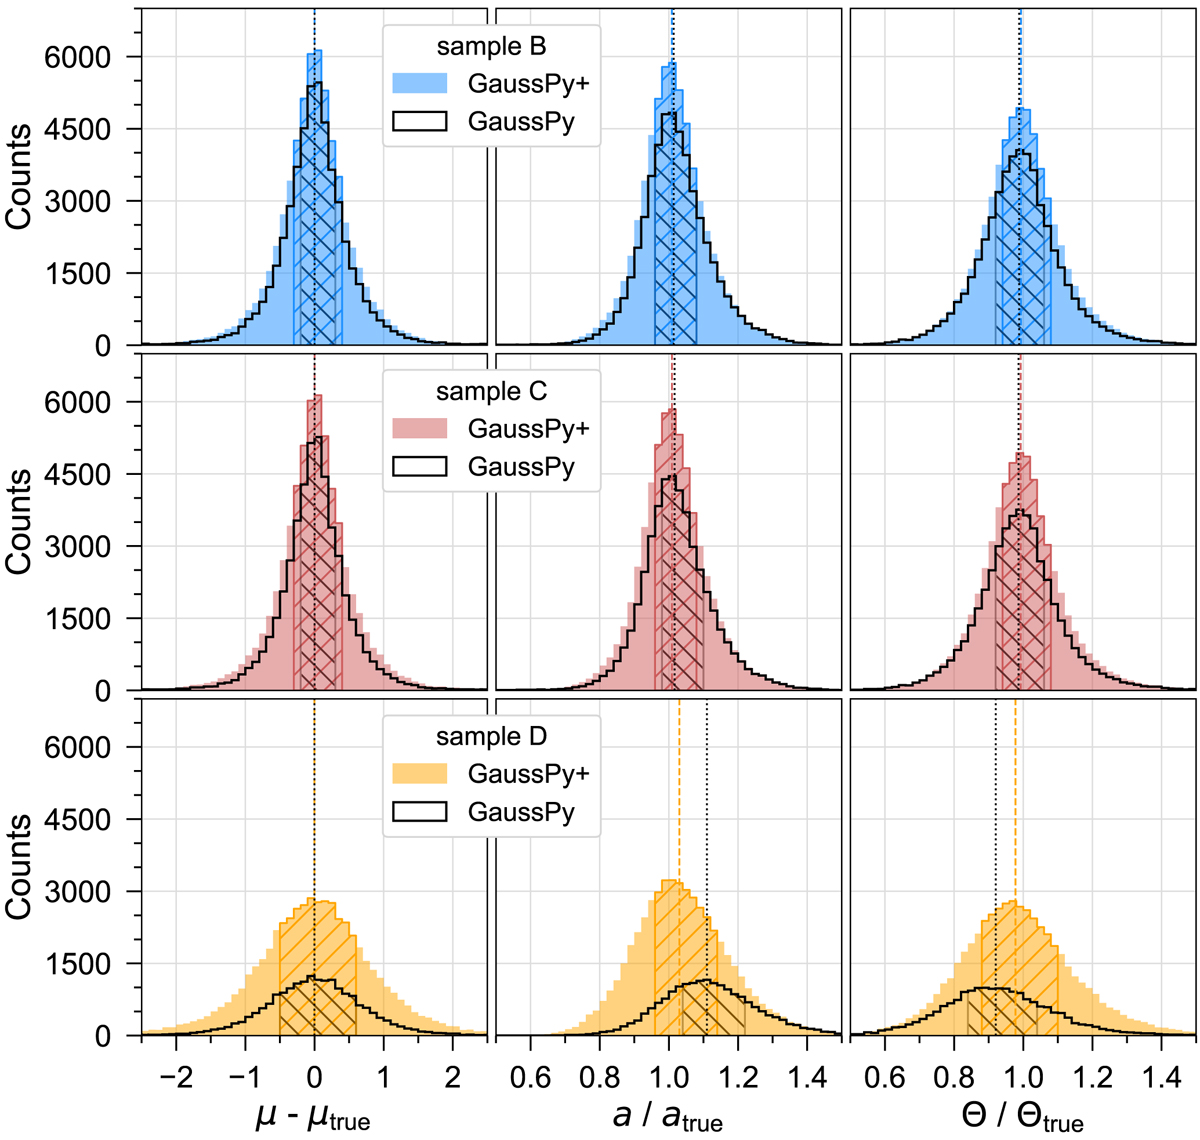
Comparison of the performance results of decompositions with GAUSSPY+ and GAUSSPY for different samples of synthetic spectra. The distribution shows how the fitted parameter values (mean position μ, amplitude a, and FWHM Θ from left to right, respectively) compare to the true parameter values used to create the synthetic spectra. The unfilled and coloured histograms show the distribution of fit components obtained with GAUSSPY and GAUSSPY+, respectively. Hatched areas correspond to the interquartile ranges and the vertical lines indicate the median value of the distribution (coloured and black for the GAUSSPY+ and GAUSSPY results, respectively. The improved fitting routine of GAUSSPY+ leads to a significant increase of correctly fitted parameters (see also Table 1 and Sect. 4 for more details).
Current usage metrics show cumulative count of Article Views (full-text article views including HTML views, PDF and ePub downloads, according to the available data) and Abstracts Views on Vision4Press platform.
Data correspond to usage on the plateform after 2015. The current usage metrics is available 48-96 hours after online publication and is updated daily on week days.
Initial download of the metrics may take a while.