Fig. 11.
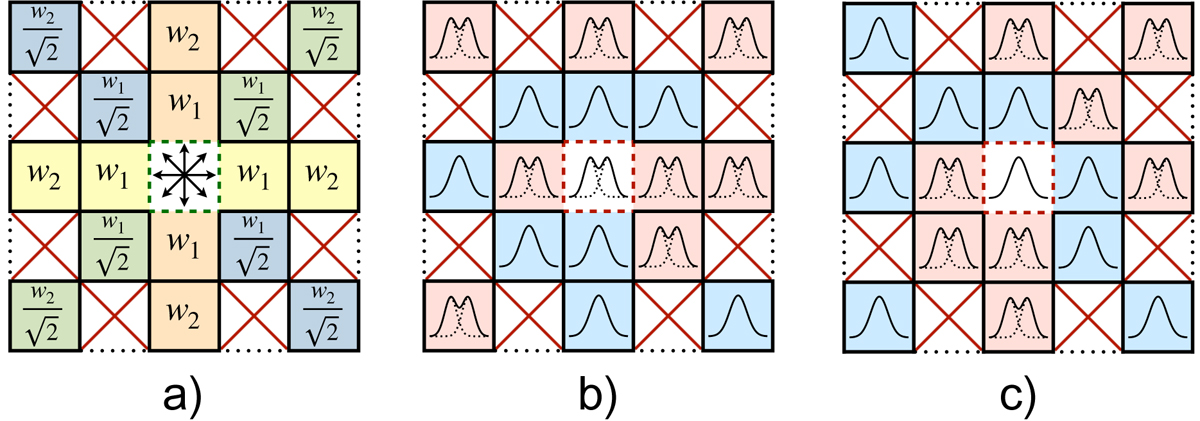
Illustration of phase two of the spatial refitting routine of GAUSSPY+. Each 5 × 5 square shows a central spectrum (in white) and its surrounding neighbours. White squares that are crossed out are not considered. Left panel: Principal directions for which we check for consistency of the centroid positions and shows the applied weights w1 and w2 attached to the neighbouring spectra. Middle and right panels: Two different example cases with simple fits of one and two Gaussian components shaded in blue and red, respectively. Based on the fits of the neighbouring spectra we would try to refit the central spectrum in the first case (panel b) with one Gaussian component, whereas the central spectrum in the second case (panel c) is already consistent with what we would expect from our spatial consistency check of the centroid positions. See Sect. 3.3.2 for more details.
Current usage metrics show cumulative count of Article Views (full-text article views including HTML views, PDF and ePub downloads, according to the available data) and Abstracts Views on Vision4Press platform.
Data correspond to usage on the plateform after 2015. The current usage metrics is available 48-96 hours after online publication and is updated daily on week days.
Initial download of the metrics may take a while.