Fig. 8.
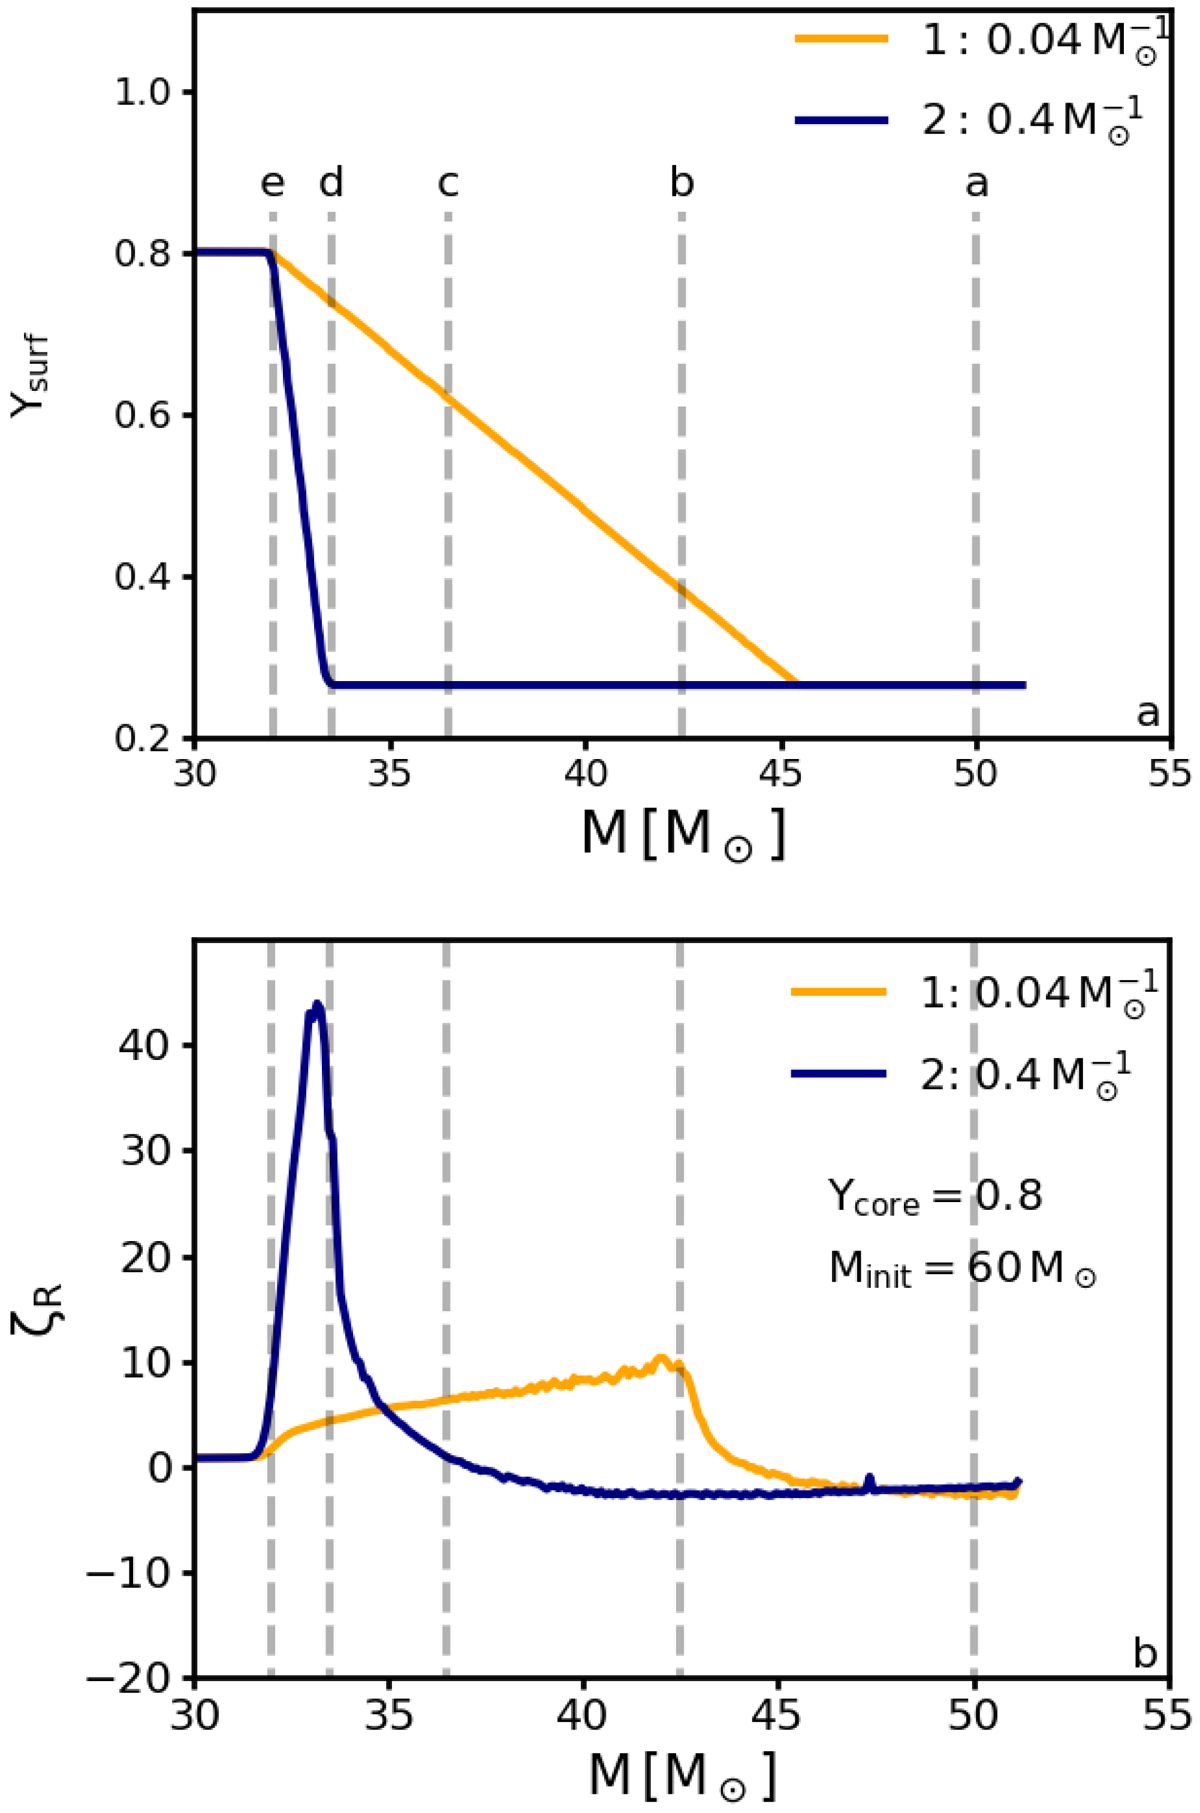
Top panel: helium surface abundance as function of the total mass of the two stellar models from which the initial donor star models for our binary evolution calculations are derived. They are constructed such that mass located above the lines labelled a to e was removed before the binary calculation was started. Bottom panel: mass–radius exponent for the models as a function of the remaining stellar mass. Dashed lines correspond to the masses (labels a to e) in the upper panel.
Current usage metrics show cumulative count of Article Views (full-text article views including HTML views, PDF and ePub downloads, according to the available data) and Abstracts Views on Vision4Press platform.
Data correspond to usage on the plateform after 2015. The current usage metrics is available 48-96 hours after online publication and is updated daily on week days.
Initial download of the metrics may take a while.