Fig. 2.
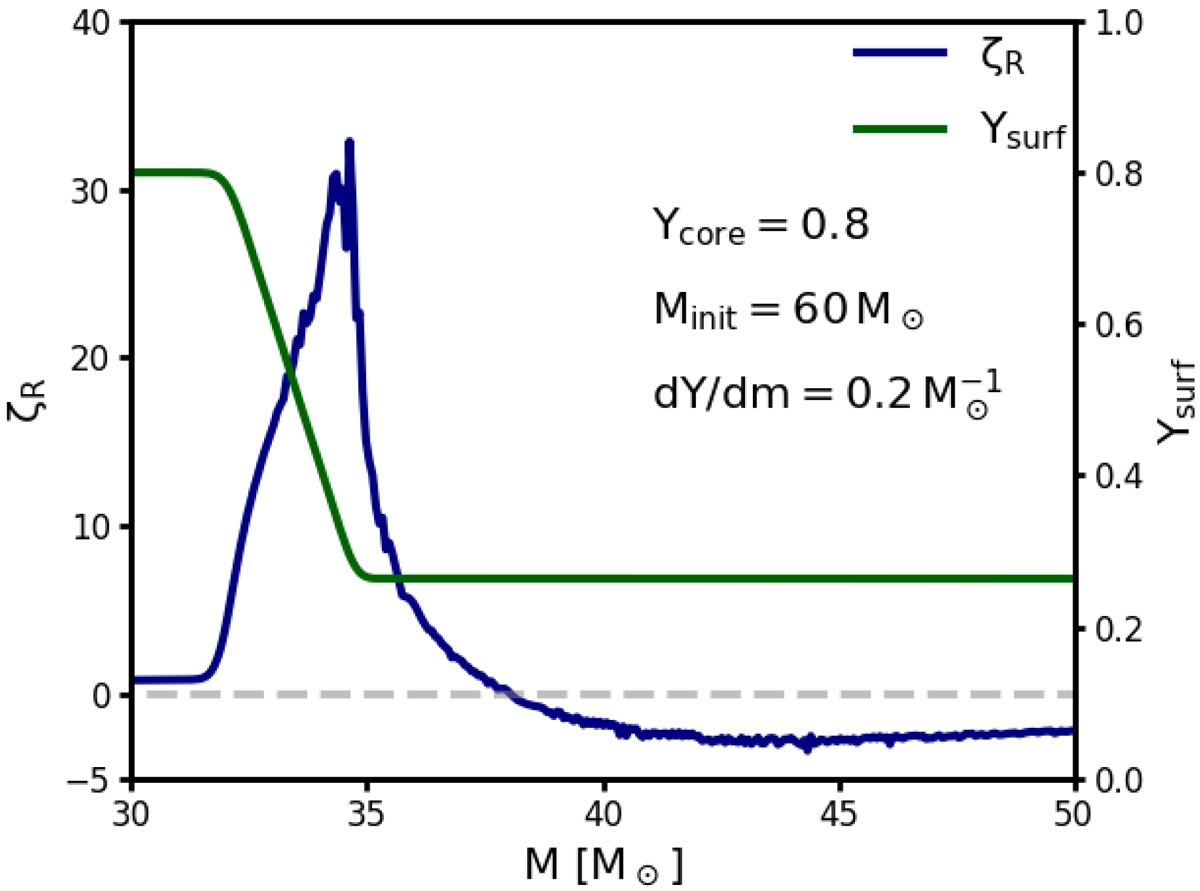
Mass–radius exponent (blue) of our initial 60 M⊙ model evolved to a central helium abundance of 0.8, and a H/He gradient of ![]() that is then exposed to a constant mass-loss rate of 10−5 M⊙ yr−1 as a function of the remaining stellar mass. The green line gives the surface helium abundance. Because mixing is inhibited during the mass-loss phase, the surface helium-abundance evolution reflects the internal helium profile of the initial model.
that is then exposed to a constant mass-loss rate of 10−5 M⊙ yr−1 as a function of the remaining stellar mass. The green line gives the surface helium abundance. Because mixing is inhibited during the mass-loss phase, the surface helium-abundance evolution reflects the internal helium profile of the initial model.
Current usage metrics show cumulative count of Article Views (full-text article views including HTML views, PDF and ePub downloads, according to the available data) and Abstracts Views on Vision4Press platform.
Data correspond to usage on the plateform after 2015. The current usage metrics is available 48-96 hours after online publication and is updated daily on week days.
Initial download of the metrics may take a while.