Fig. 14.
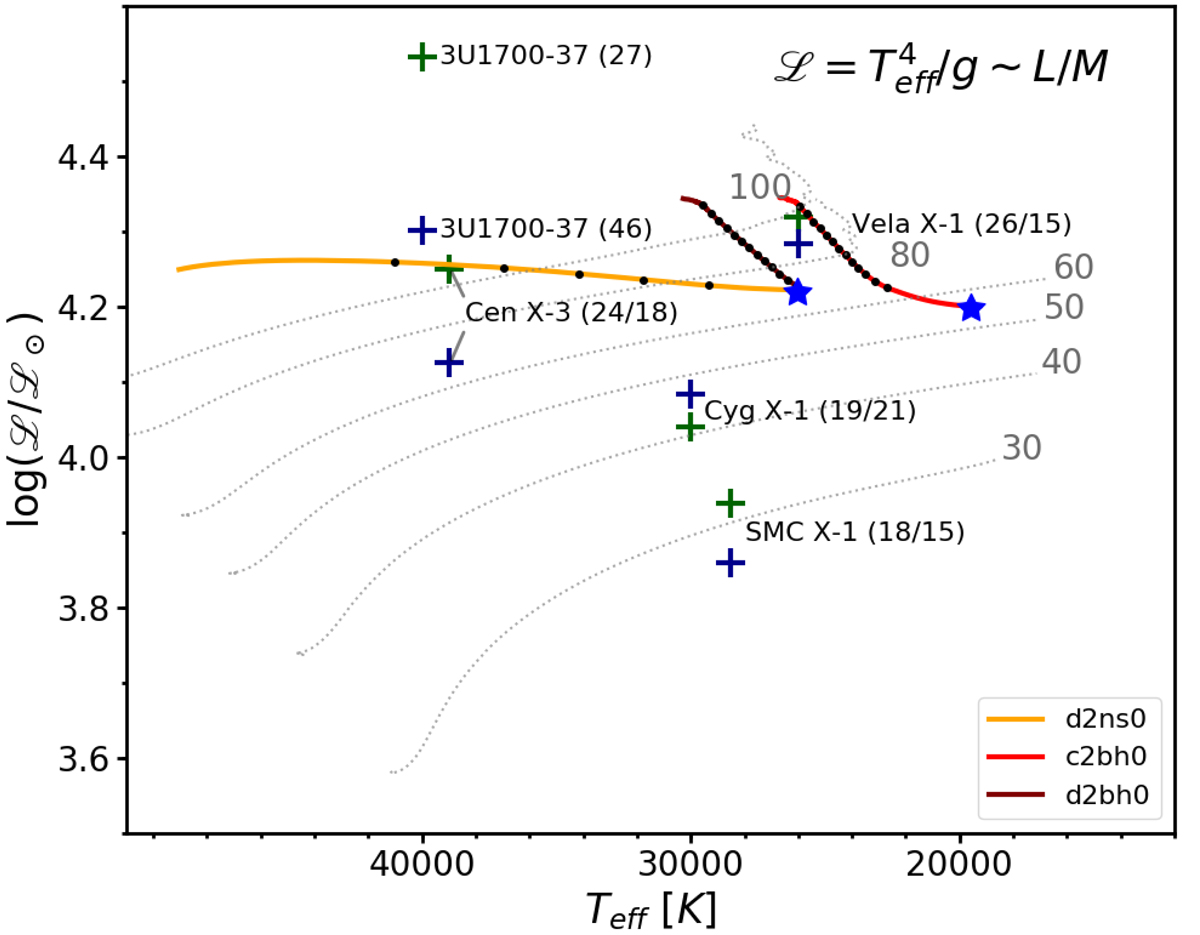
Spectroscopic Hertzsprung–Russel diagram including data for SGXBs from Conti (1978; green crosses) and Falanga et al. (2015; blue crosses). The name of the source is added to the symbols. The parentheses include the donor masses as measured by Conti (1978) and Falanga et al. (2015). The grey dashed lines are tracks from single-star evolutionary models (Brott et al. 2011). The grey numbers indicate the initial mass of the corresponding stellar model. Red and orange lines indicate the evolution of our binary models. The starting point of each model is labelled with a blue star. The black dots correspond to time steps of 50 000 years.
Current usage metrics show cumulative count of Article Views (full-text article views including HTML views, PDF and ePub downloads, according to the available data) and Abstracts Views on Vision4Press platform.
Data correspond to usage on the plateform after 2015. The current usage metrics is available 48-96 hours after online publication and is updated daily on week days.
Initial download of the metrics may take a while.