Fig. 11.
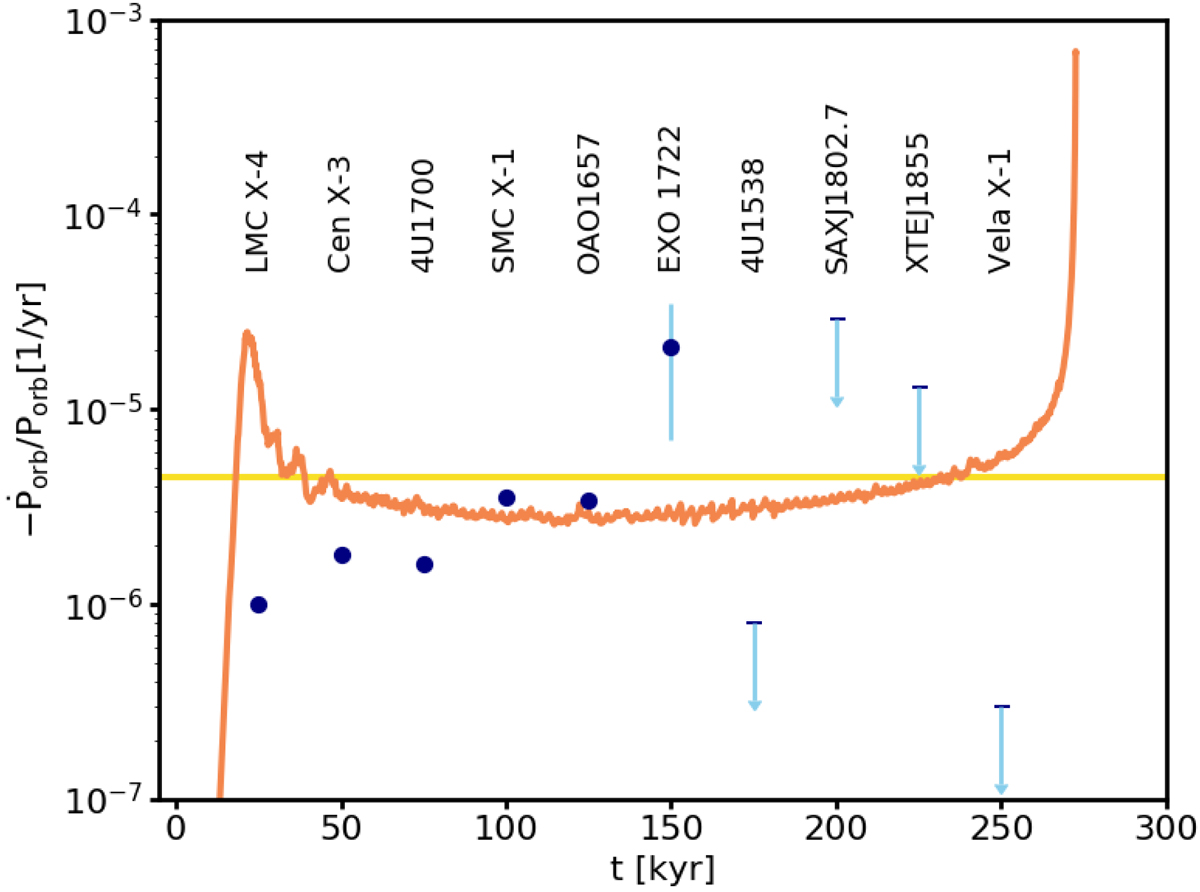
Evolution of the orbital period derivative Ṗ/P of our model d2ns0 shown in Fig. 9 as given by the numerical simulation (orange line), together with our analytic estimate for the same model (see text; yellow line). Overplotted are the empirical decay rates of ten SGXBs as inferred by Falanga et al. (2015), who give six measured values with 1σ error bars (blue dots; for most of these, the error bar is smaller than the size of the dot) and four upper limits (blue arrows). We note that the time axis has no meaning for the period derivatives of the observed sources.
Current usage metrics show cumulative count of Article Views (full-text article views including HTML views, PDF and ePub downloads, according to the available data) and Abstracts Views on Vision4Press platform.
Data correspond to usage on the plateform after 2015. The current usage metrics is available 48-96 hours after online publication and is updated daily on week days.
Initial download of the metrics may take a while.