Free Access
Fig. 9.
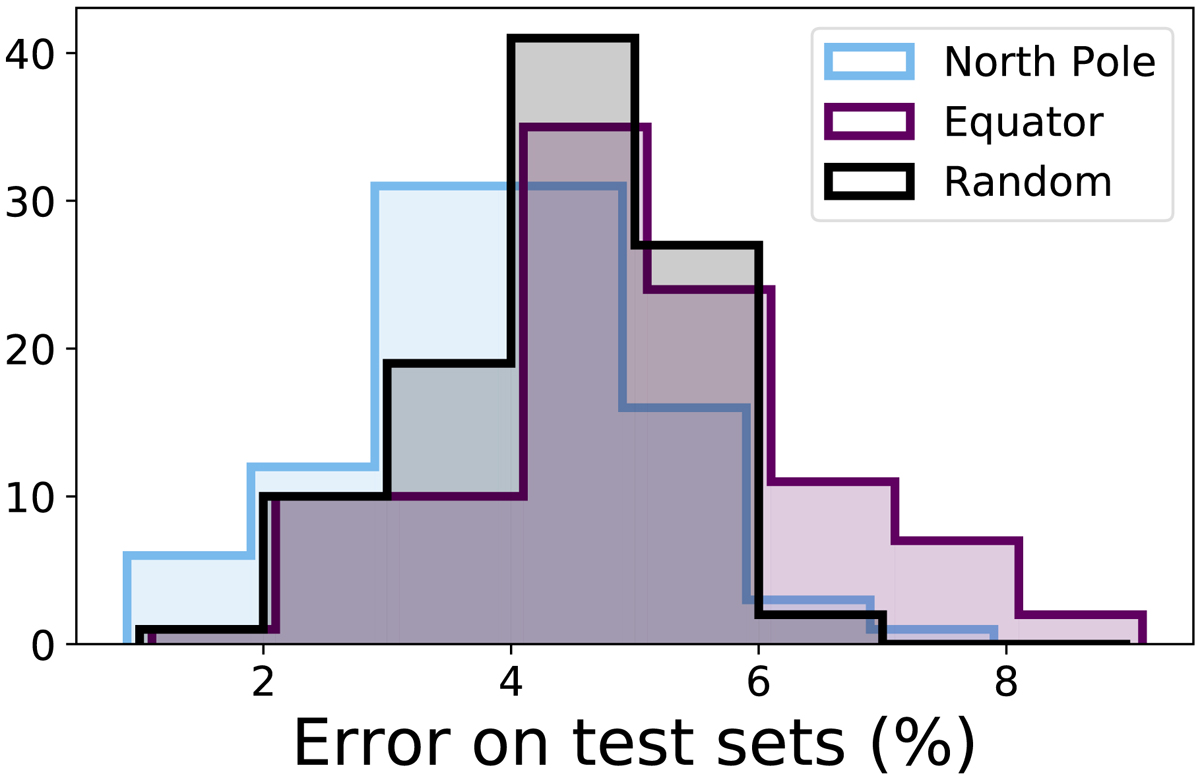
Distribution of NN error on three groups of test sets, where MNIST images have been projected: (i) at the north pole (blue), (ii) at the equator (purple) and (iii) on random positions on the sphere (black). Each group is composed by 100 test sets of 300 images each.
Current usage metrics show cumulative count of Article Views (full-text article views including HTML views, PDF and ePub downloads, according to the available data) and Abstracts Views on Vision4Press platform.
Data correspond to usage on the plateform after 2015. The current usage metrics is available 48-96 hours after online publication and is updated daily on week days.
Initial download of the metrics may take a while.