Free Access
Fig. A.2.
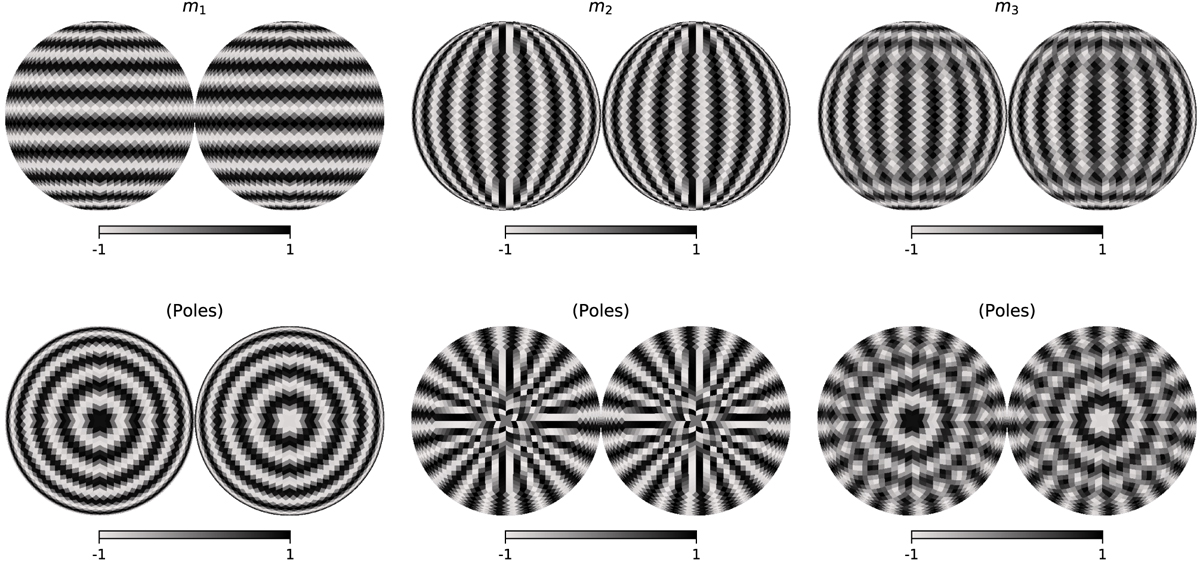
Maps used in the explanation of convolution in Sec. 3.2.1. All the maps have Nside = 16. Each map is shown using two orthographic projections: in the upper row, maps are represented as seen from the Equatorial plane; in the lower row, maps are centered around the poles.
Current usage metrics show cumulative count of Article Views (full-text article views including HTML views, PDF and ePub downloads, according to the available data) and Abstracts Views on Vision4Press platform.
Data correspond to usage on the plateform after 2015. The current usage metrics is available 48-96 hours after online publication and is updated daily on week days.
Initial download of the metrics may take a while.