Free Access
Fig. 9
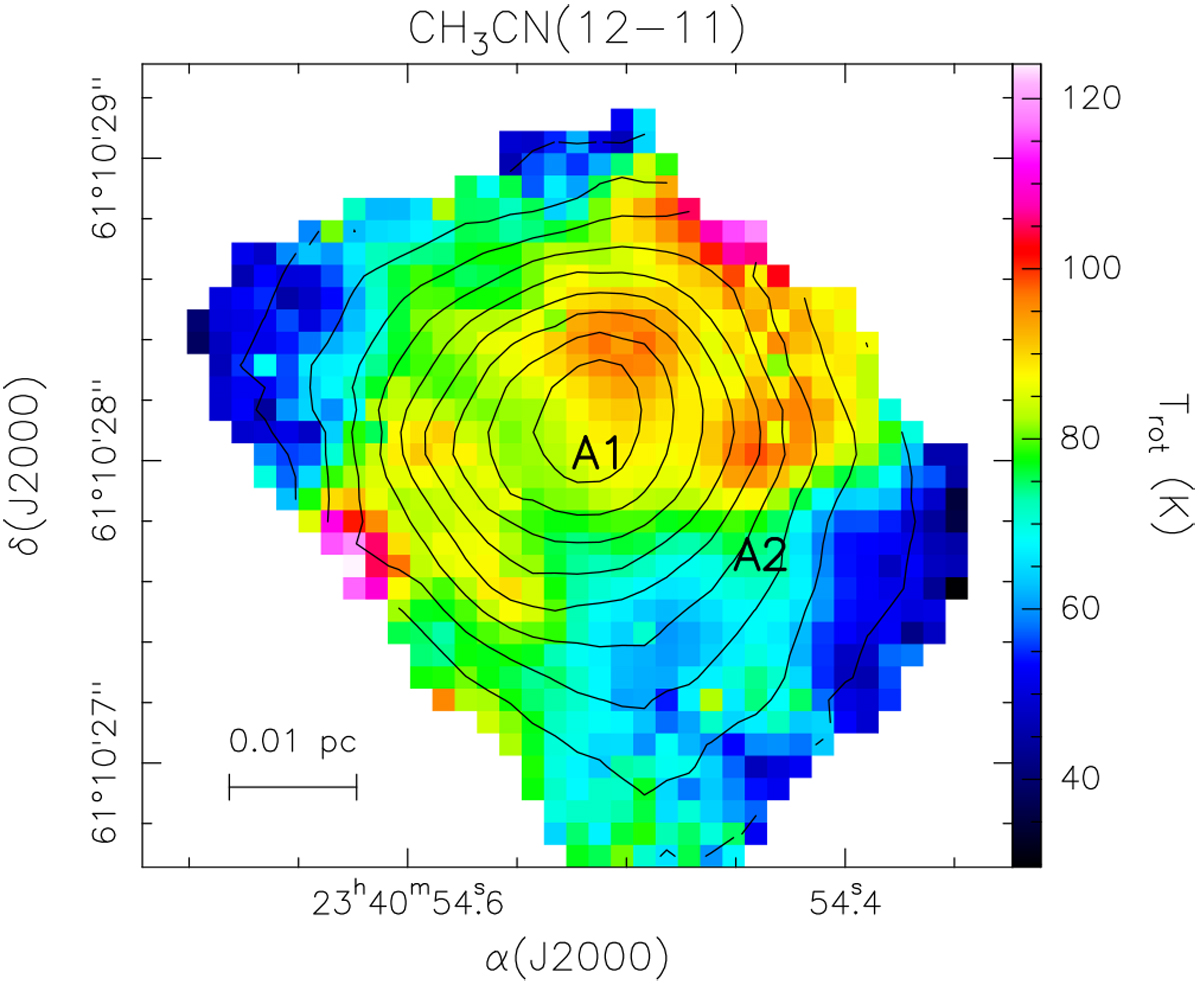
Maps of the CH3CN rotational temperature (color image) and column density (contours) obtained with the XCLASS program. The labels have the same meaning as in Fig. 4. Contour levels range from 2 × 10¹³ to 1014 in steps of 1013 cm−2. Typical uncertainties on the values of the rotational temperature are 10–20%.
Current usage metrics show cumulative count of Article Views (full-text article views including HTML views, PDF and ePub downloads, according to the available data) and Abstracts Views on Vision4Press platform.
Data correspond to usage on the plateform after 2015. The current usage metrics is available 48-96 hours after online publication and is updated daily on week days.
Initial download of the metrics may take a while.