Fig. 8
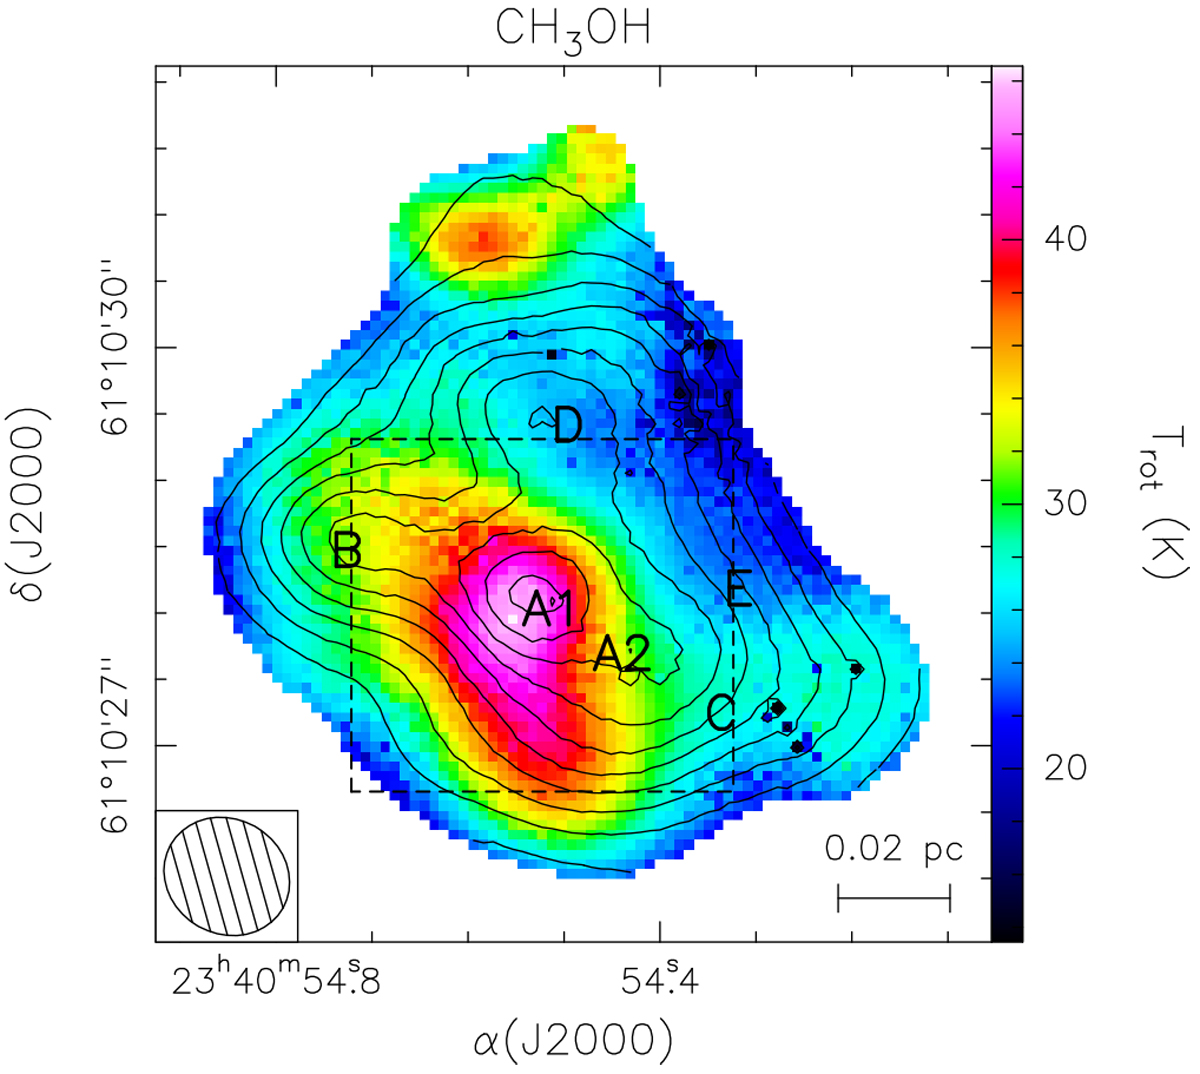
Maps of the CH3OH rotational temperature (color image) and column density (contours) obtained with the XCLASS program. The labels indicate the cores. Contour levels range from 2 × 10¹⁵ to 1.1 × 10¹⁶ in steps of 1015 cm−2. Typical uncertainties on the values of the rotational temperature are 10–20%. The ellipse in the bottom left denotes the synthesized beam. The dashed box corresponds to the region shown in Fig. 9.
Current usage metrics show cumulative count of Article Views (full-text article views including HTML views, PDF and ePub downloads, according to the available data) and Abstracts Views on Vision4Press platform.
Data correspond to usage on the plateform after 2015. The current usage metrics is available 48-96 hours after online publication and is updated daily on week days.
Initial download of the metrics may take a while.