Fig. 7
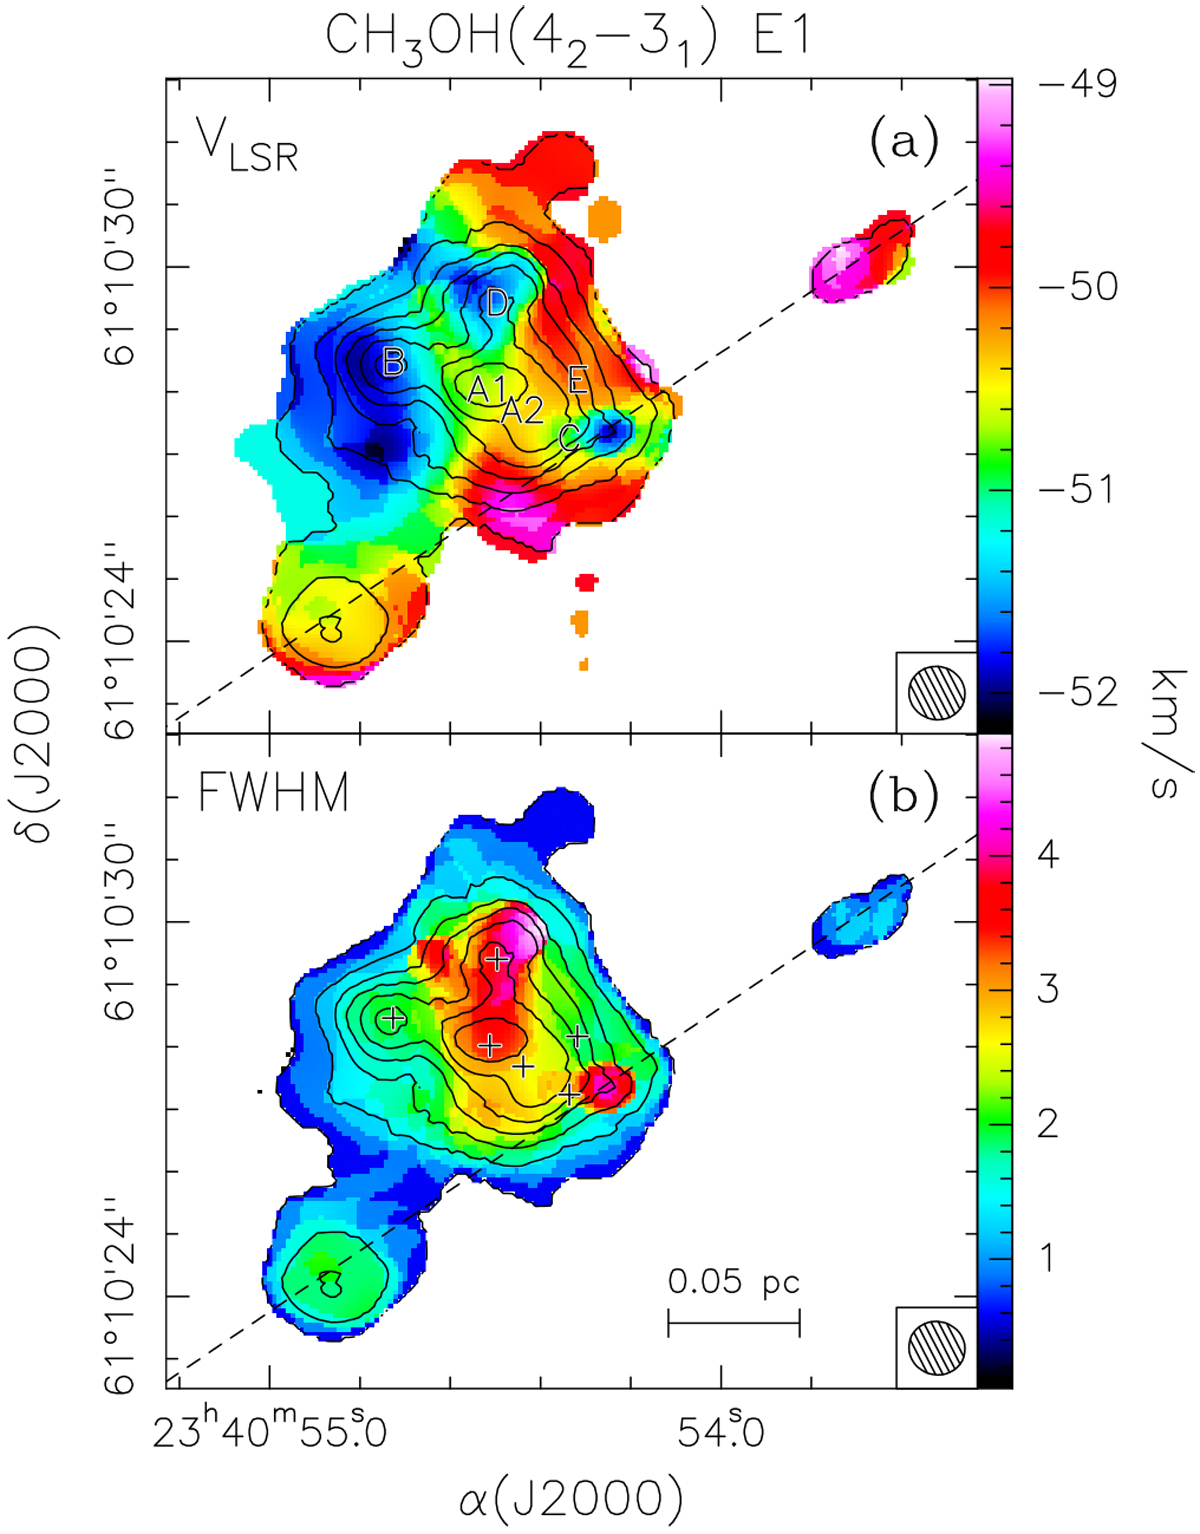
Panel a: map of the zero moment (integrated intensity; contours) of the CH3 OH(42–31) E1 line overlaid on the map (color image) of the first moment of the same transition. Contour levels range from 0.05 to 1.25 in steps of 0.2 Jy beam−1 km s−1. The ellipse in the bottom right represents the synthesized beam. The dashed line has the same meaning as in Fig. 6. Panel b: same as top panel, but for the second moment of the methanol line.
Current usage metrics show cumulative count of Article Views (full-text article views including HTML views, PDF and ePub downloads, according to the available data) and Abstracts Views on Vision4Press platform.
Data correspond to usage on the plateform after 2015. The current usage metrics is available 48-96 hours after online publication and is updated daily on week days.
Initial download of the metrics may take a while.