Free Access
Fig. 5
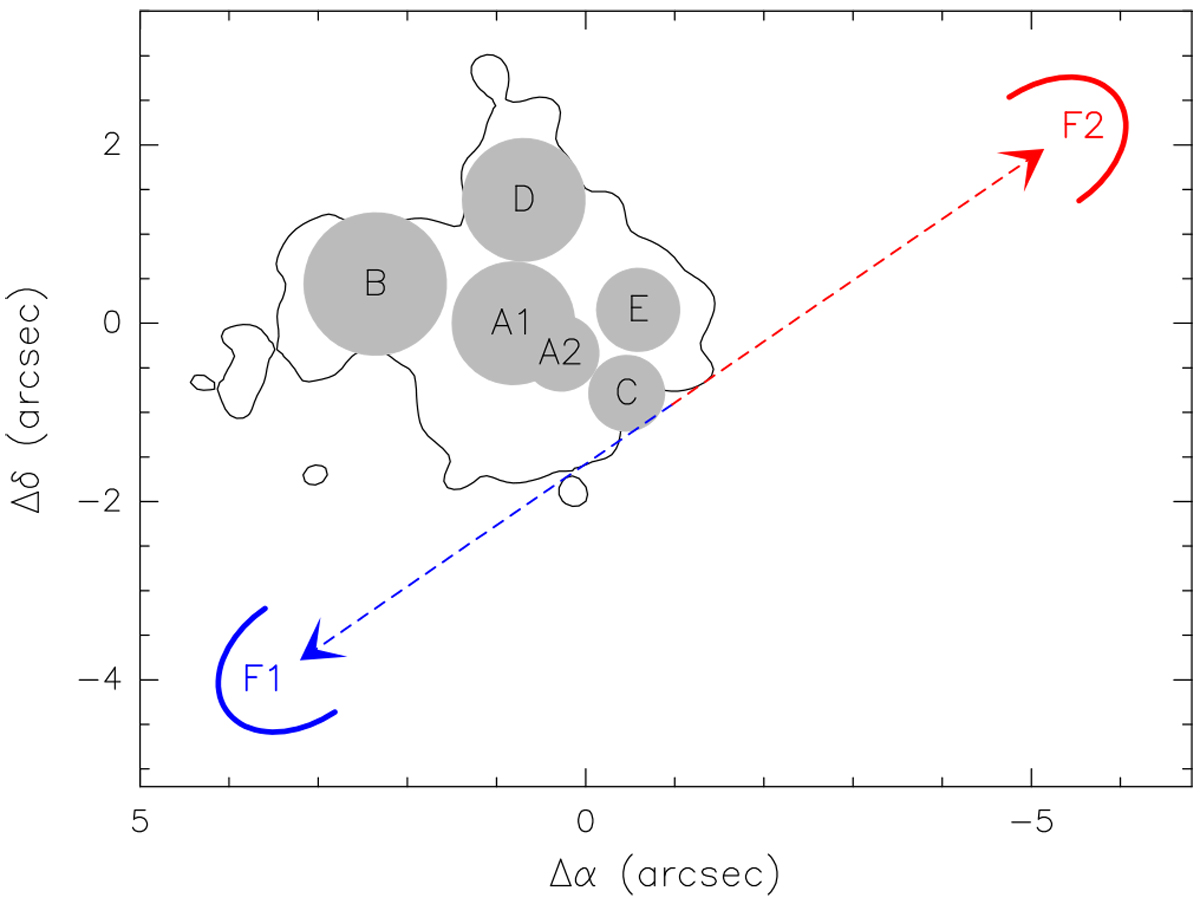
Sketch of the cores identified by us in IRAS 23385+6053. The contour corresponds to the 5σ level of the continuum emission. The two arrows and arcs indicate the direction and location of the expanding lobes (F1 and F2) of the bipolar outflow detected in the H2 CO and CH3 OH emission, perhaps originating from core C.
Current usage metrics show cumulative count of Article Views (full-text article views including HTML views, PDF and ePub downloads, according to the available data) and Abstracts Views on Vision4Press platform.
Data correspond to usage on the plateform after 2015. The current usage metrics is available 48-96 hours after online publication and is updated daily on week days.
Initial download of the metrics may take a while.