Fig. 4
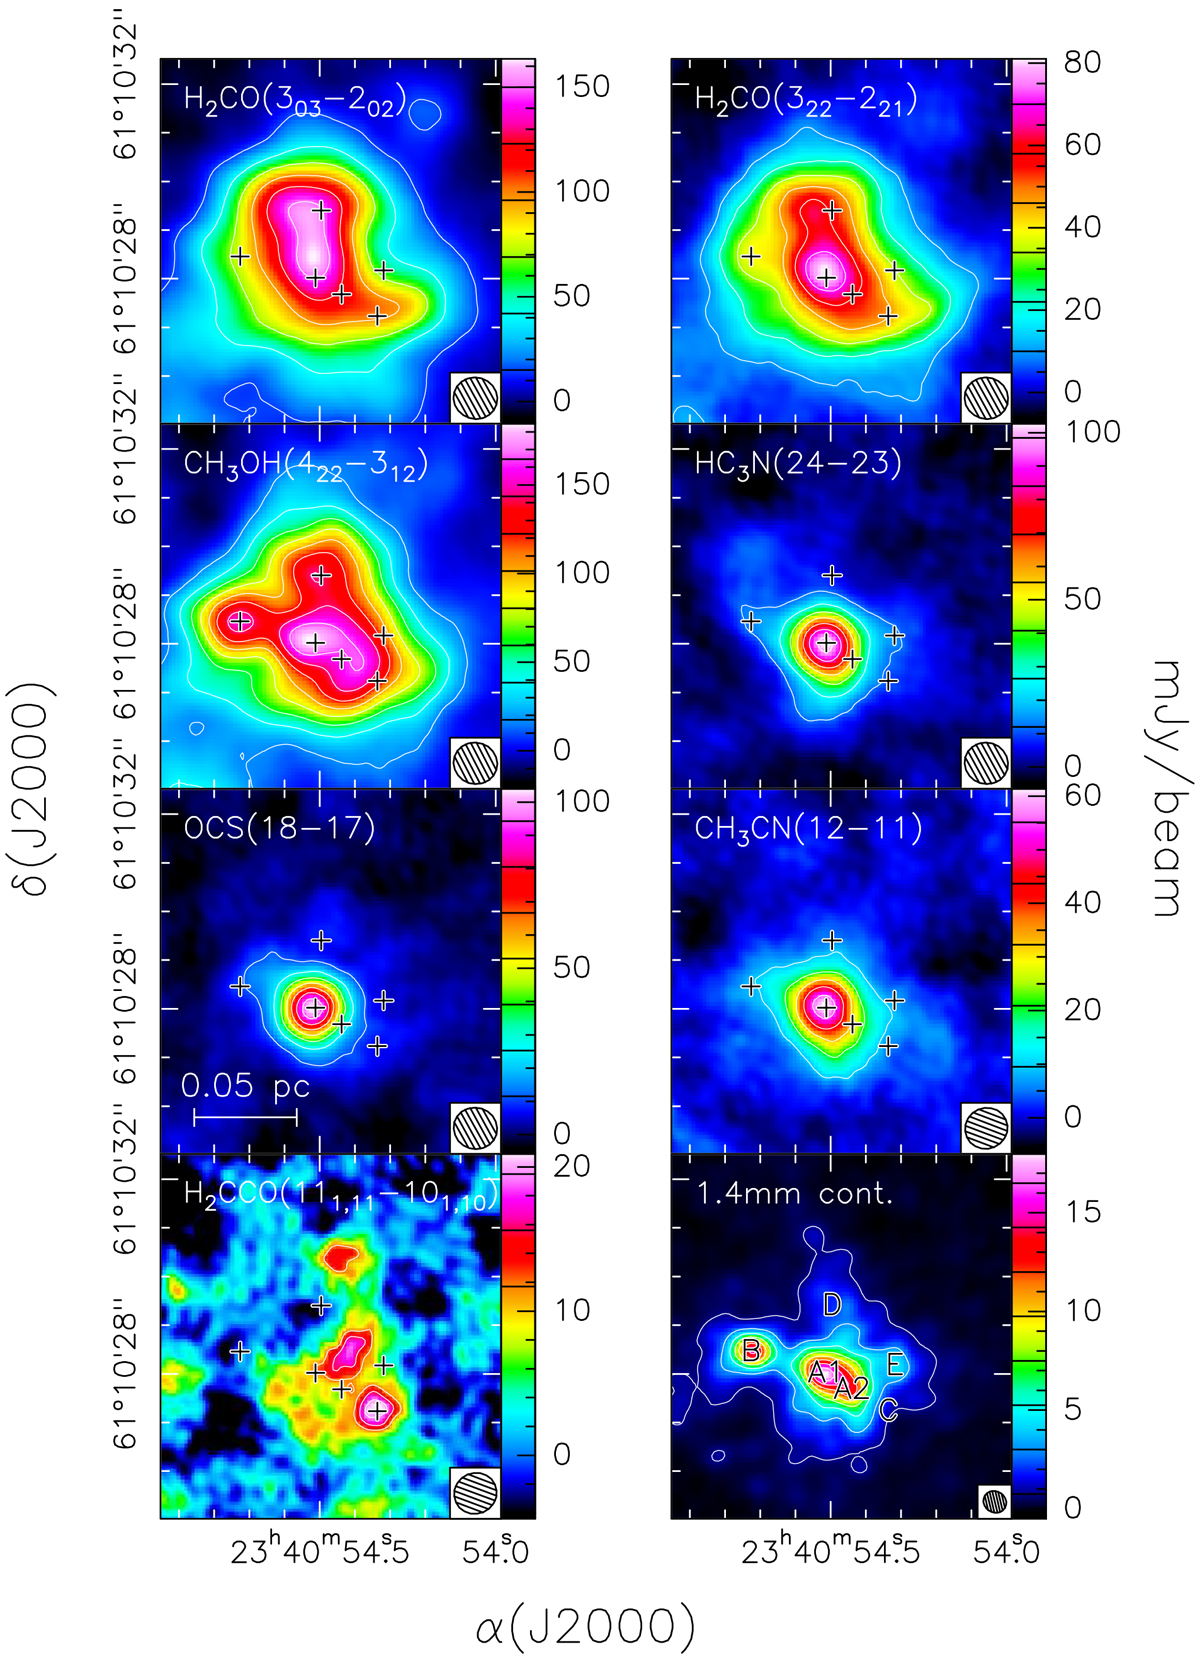
Maps of the mean emission in various molecular lines. For the sake of direct comparison with the line maps we show again the map of the continuum emission in the bottom right panel. For each map, the values of the contour levels are marked in the corresponding color scale. The crosses and letters indicate the positions of the six cores identified by us (see also Fig. 5). Cores A1, B, and E correspond to the crosses in Fig. 2. The ellipse in the bottom right of each panel is the synthesized beam.
Current usage metrics show cumulative count of Article Views (full-text article views including HTML views, PDF and ePub downloads, according to the available data) and Abstracts Views on Vision4Press platform.
Data correspond to usage on the plateform after 2015. The current usage metrics is available 48-96 hours after online publication and is updated daily on week days.
Initial download of the metrics may take a while.