Free Access
Fig. 2
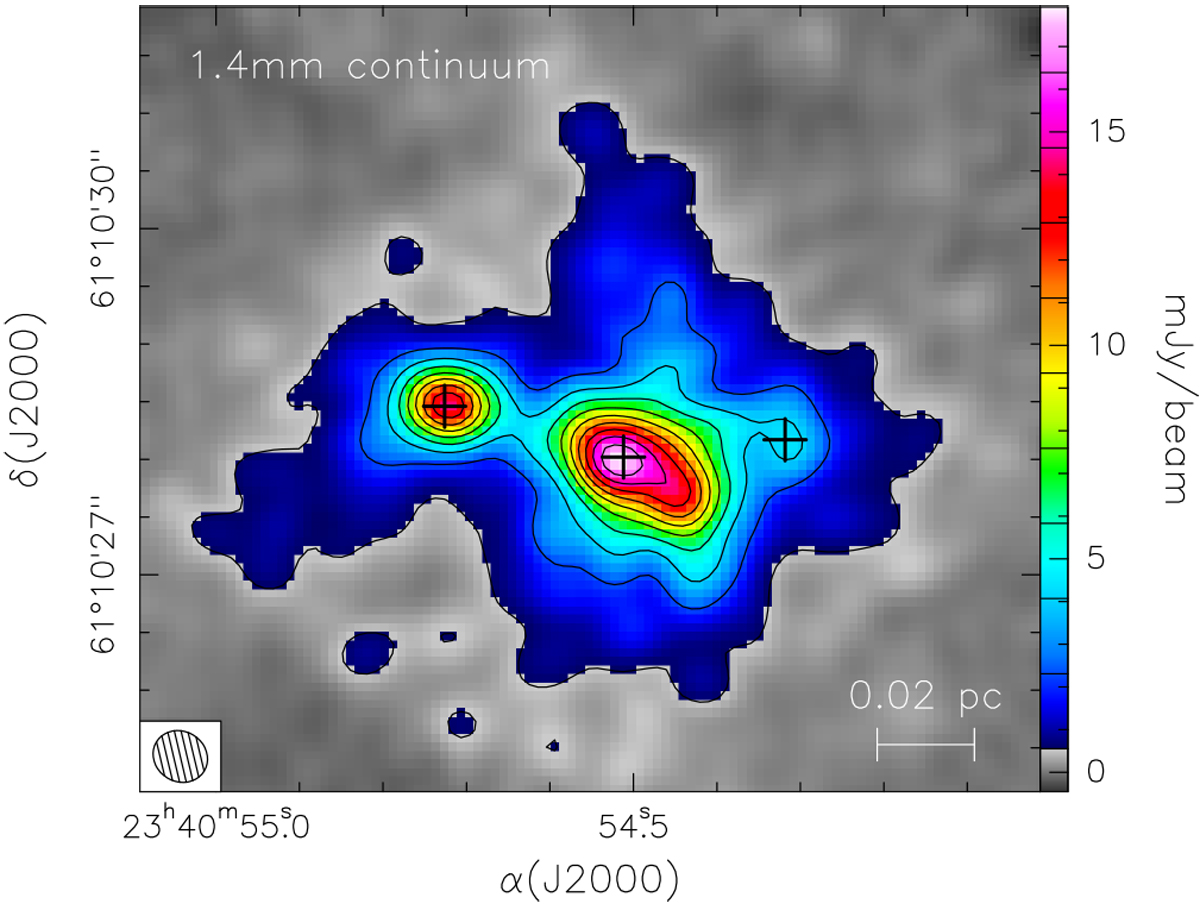
Map of the 1.4 mm continuum emission from IRAS 23385+6053. The values of the contour levels are marked in the color scale to the right. The minimum contour level (0.55 mJy beam−1) corresponds to 5σ. The crosses indicate the positions of the three cores identified by BEU18, corresponding to A1, B, and E in Table 1.
Current usage metrics show cumulative count of Article Views (full-text article views including HTML views, PDF and ePub downloads, according to the available data) and Abstracts Views on Vision4Press platform.
Data correspond to usage on the plateform after 2015. The current usage metrics is available 48-96 hours after online publication and is updated daily on week days.
Initial download of the metrics may take a while.