Free Access
Fig. 15
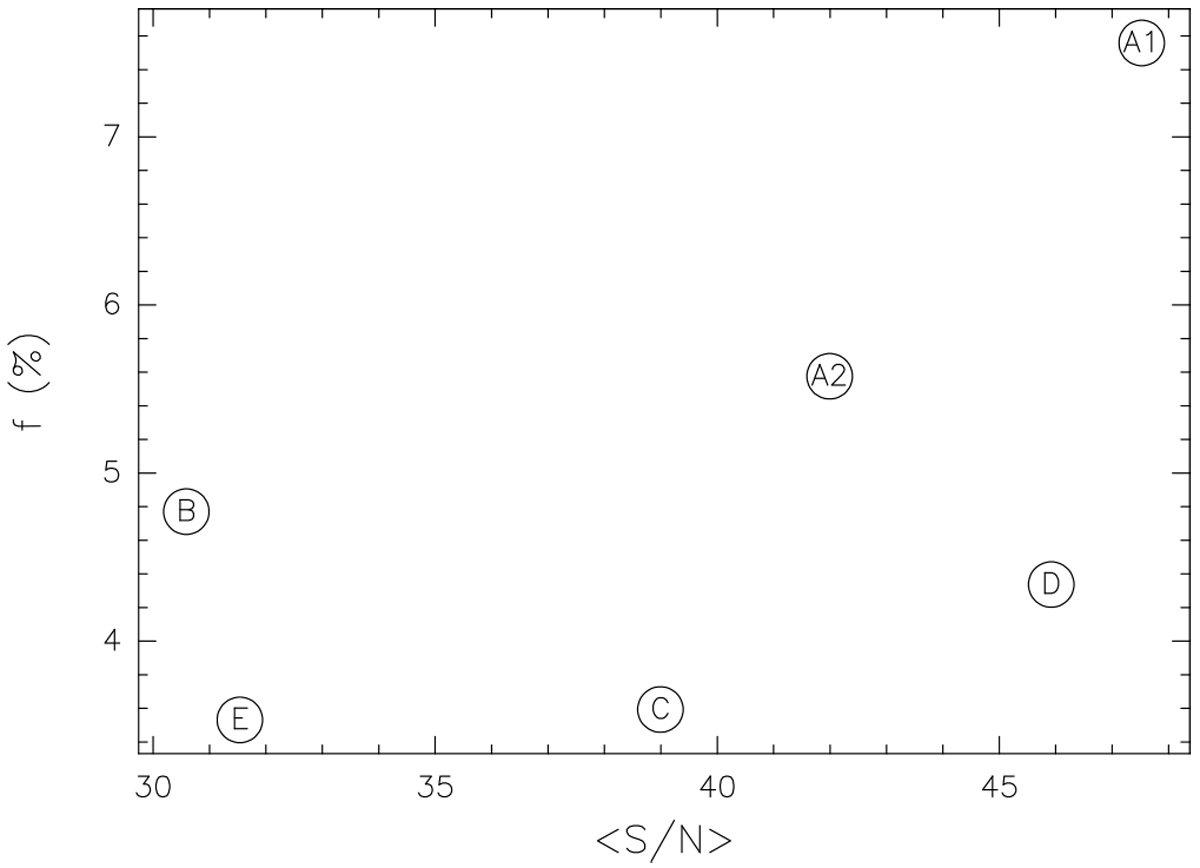
Fraction of detected channels in the WIDEX spectrum of each core vs. the ratio between the mean intensity in the detected channels and the noise of the corresponding spectrum. The names of the cores are indicated inside the points.
Current usage metrics show cumulative count of Article Views (full-text article views including HTML views, PDF and ePub downloads, according to the available data) and Abstracts Views on Vision4Press platform.
Data correspond to usage on the plateform after 2015. The current usage metrics is available 48-96 hours after online publication and is updated daily on week days.
Initial download of the metrics may take a while.