Free Access
Fig. 14
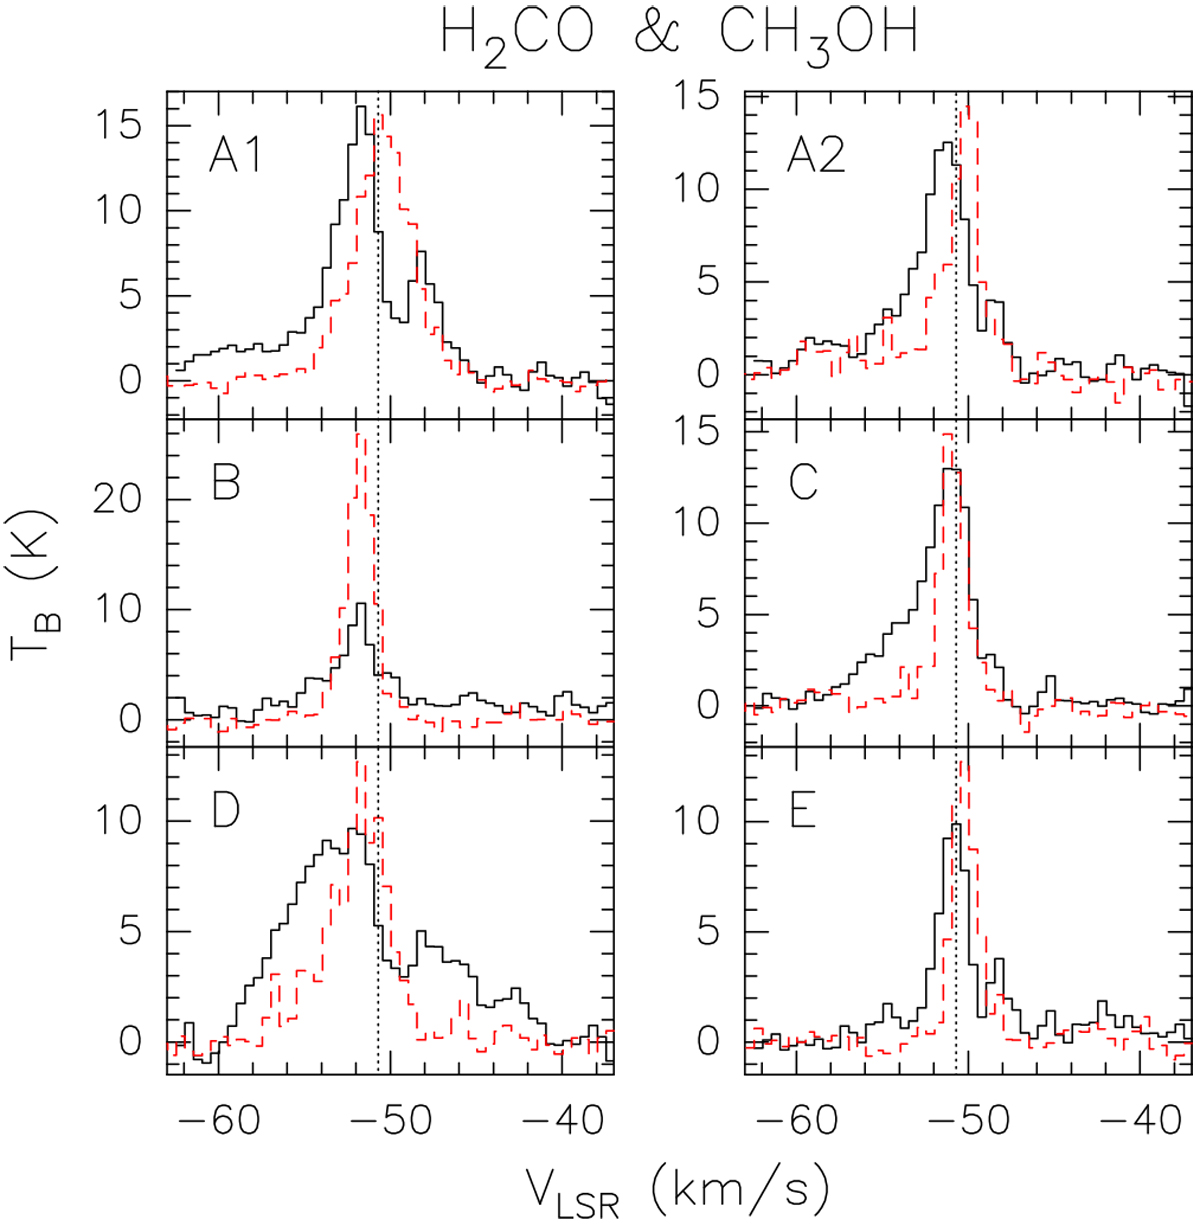
Spectra of the H2CO(303–202) (black solid histogram) and CH3OH(42–31) E1 (red dashed histogram) lines towards the positions of the six cores identified in IRAS 23385+6053. The vertical dotted line is shown to ease the comparison between spectra of different cores.
Current usage metrics show cumulative count of Article Views (full-text article views including HTML views, PDF and ePub downloads, according to the available data) and Abstracts Views on Vision4Press platform.
Data correspond to usage on the plateform after 2015. The current usage metrics is available 48-96 hours after online publication and is updated daily on week days.
Initial download of the metrics may take a while.