Fig. 13
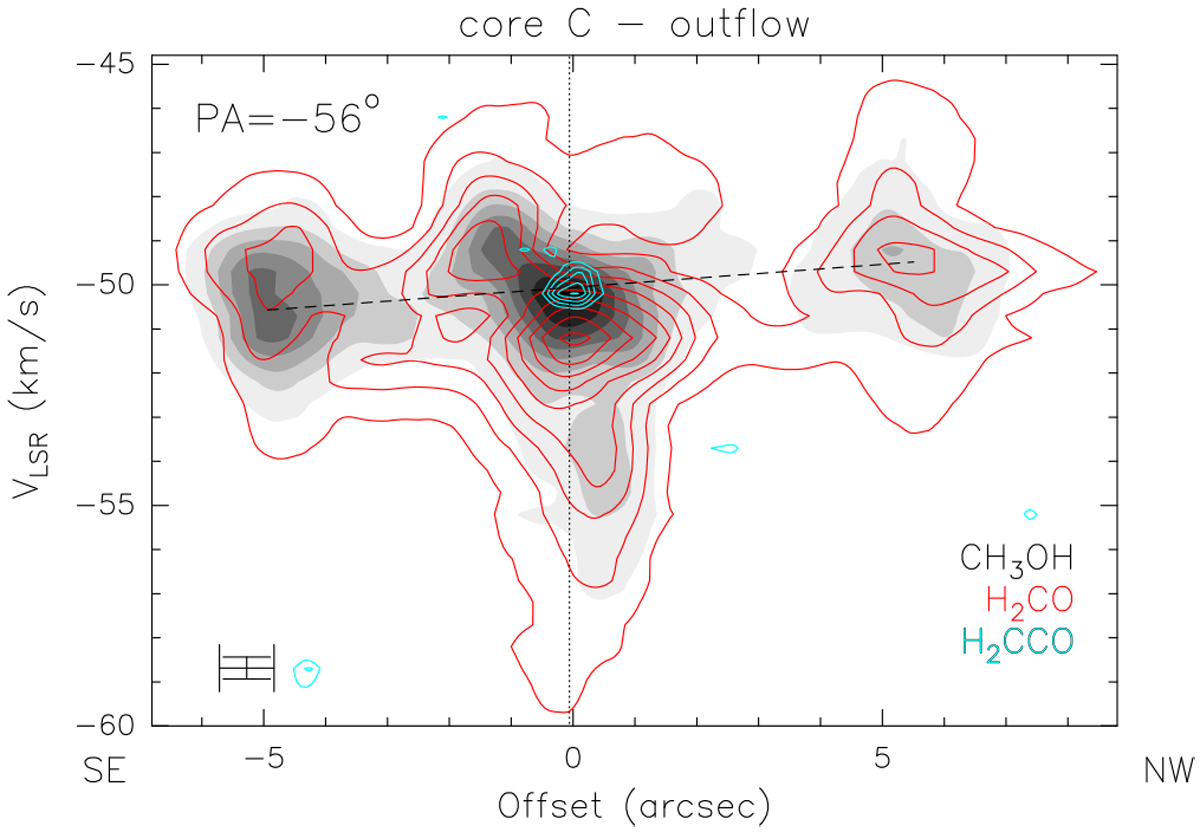
Line intensity as a function of velocity and position along the dashed line in Fig. 6 (position angle –56°). Different colors correspond to different molecular species as indicated in the bottom right. The cross in the bottom left gives the velocity and angular resolution. The dotted vertical line marks the position of core C, while the dashed line outlines the velocity trend observed in the H2 CO and CH3 OH lines. Contour levels range from 15 (5σ) to 225 in steps of 30 mJy beam−1 for CH3 OH, from 18 (5σ) to 338 in steps of 40 mJy beam−1 for H2 CO, and from 16 (4σ) to 32 in steps of 3 mJy beam−1 for H2 CCO.
Current usage metrics show cumulative count of Article Views (full-text article views including HTML views, PDF and ePub downloads, according to the available data) and Abstracts Views on Vision4Press platform.
Data correspond to usage on the plateform after 2015. The current usage metrics is available 48-96 hours after online publication and is updated daily on week days.
Initial download of the metrics may take a while.