Fig. 12
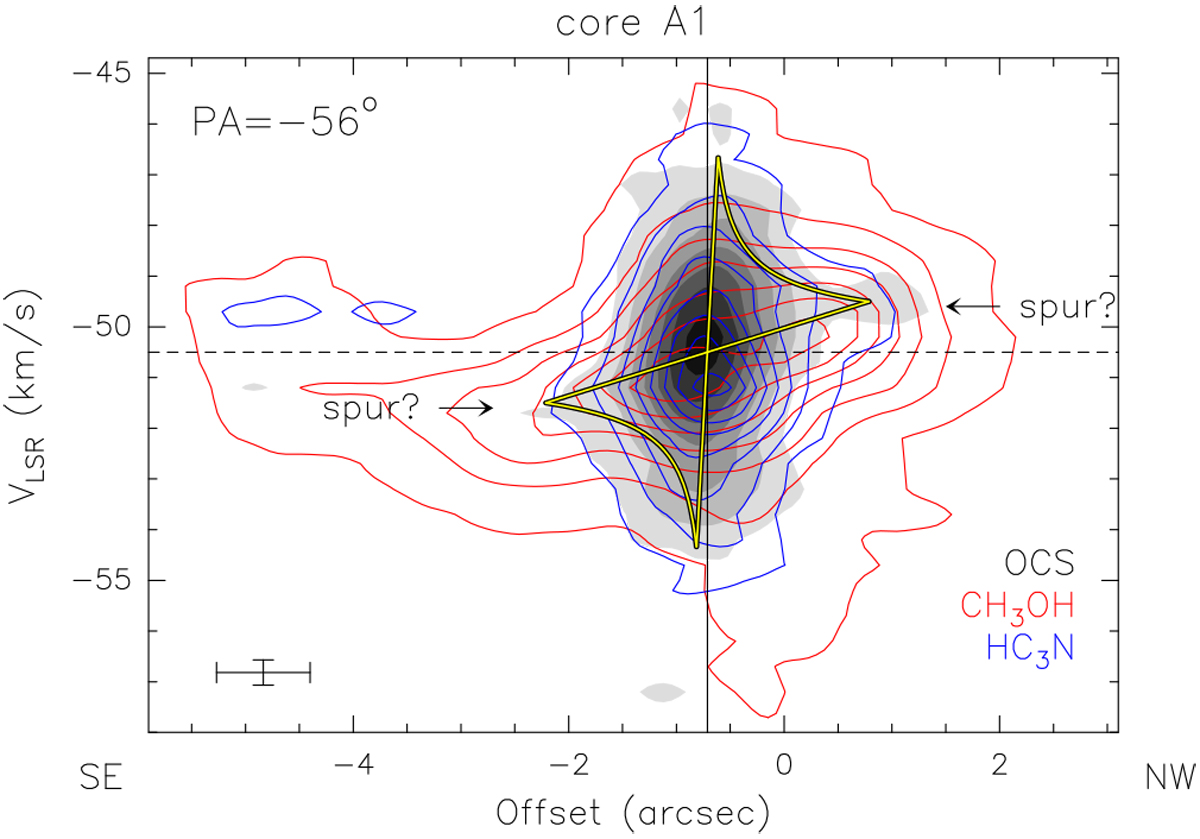
Line intensity as a function of velocity and position along the dashed line in Fig. 10 (position angle −56°). Different colors correspond to different molecular species as indicated in the bottom right. The cross in the bottom left gives the velocity and angular resolution. The arrows indicate the possible “spurs” typical of the pattern corresponding to Keplerian rotation. The yellow butterfly-shaped curve is the region inside which emission is expected for a Keplerian disk rotating about an 8 M⊙ star. Contour levels range from 15 (5σ) to 123 in steps of 18 mJy beam−1 for OCS, from 17.5 (5σ) to 332.5 in steps of 52.5 mJy beam−1 for CH3 OH, and from 13.2 (4σ) to 151.8 in steps of 19.8 mJy beam−1 for HC3 N.
Current usage metrics show cumulative count of Article Views (full-text article views including HTML views, PDF and ePub downloads, according to the available data) and Abstracts Views on Vision4Press platform.
Data correspond to usage on the plateform after 2015. The current usage metrics is available 48-96 hours after online publication and is updated daily on week days.
Initial download of the metrics may take a while.