Fig. 10
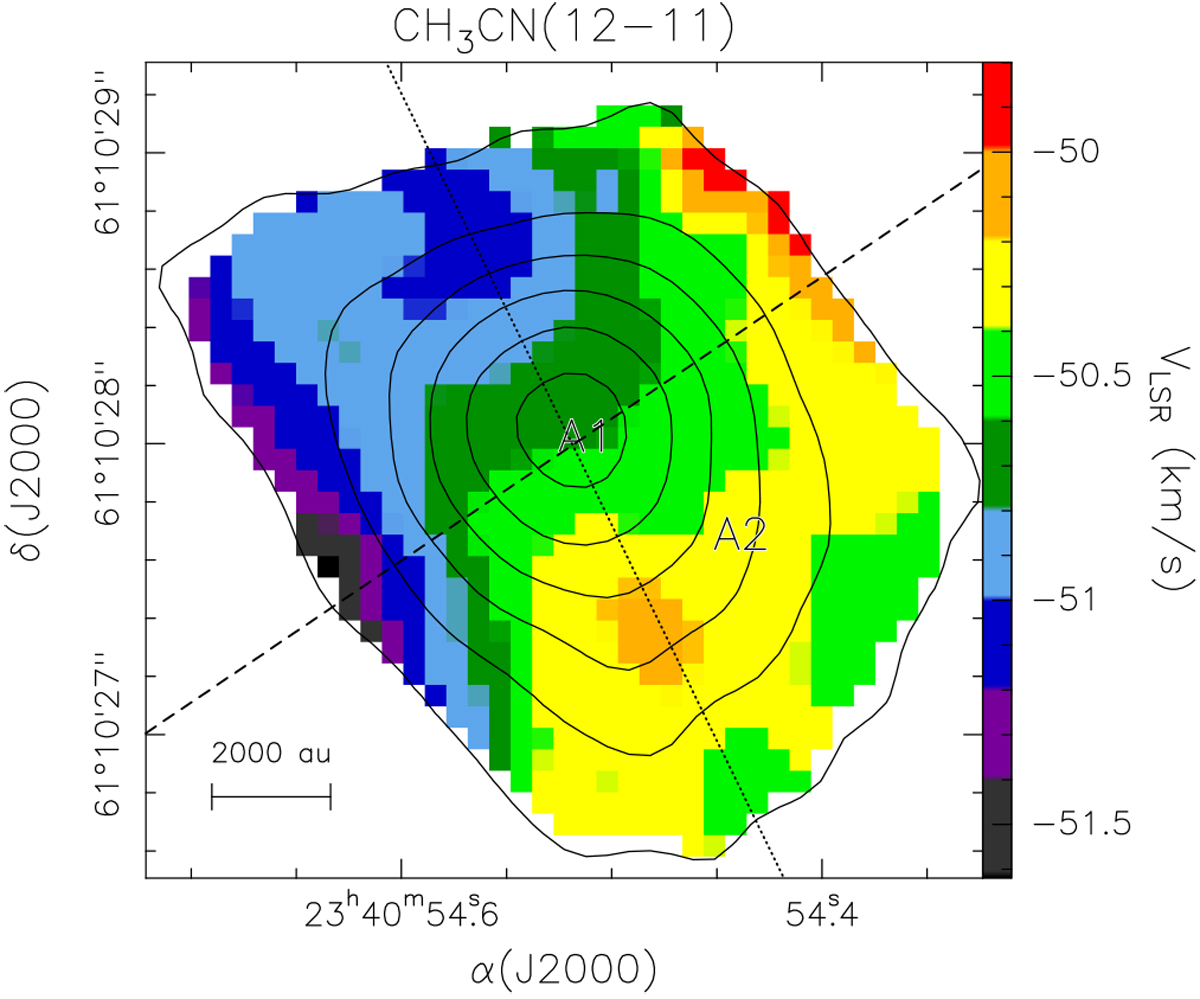
Map of the CH3CN(12–11) line emissionaveraged over the K = 0 and 1 components (contours) overlaid on the map of the velocity in the same line, obtained by simultaneously fitting the K = 0–4 components as explained in the text. Labels A1 and A2 mark the center positions of the corresponding cores. Contour levels range from 9.5 (5σ) to 57 in steps of 9.5 mJy beam−1. The dotted and dashed LINES indicate the approximate directions of the two velocity gradients.
Current usage metrics show cumulative count of Article Views (full-text article views including HTML views, PDF and ePub downloads, according to the available data) and Abstracts Views on Vision4Press platform.
Data correspond to usage on the plateform after 2015. The current usage metrics is available 48-96 hours after online publication and is updated daily on week days.
Initial download of the metrics may take a while.