Fig. 1
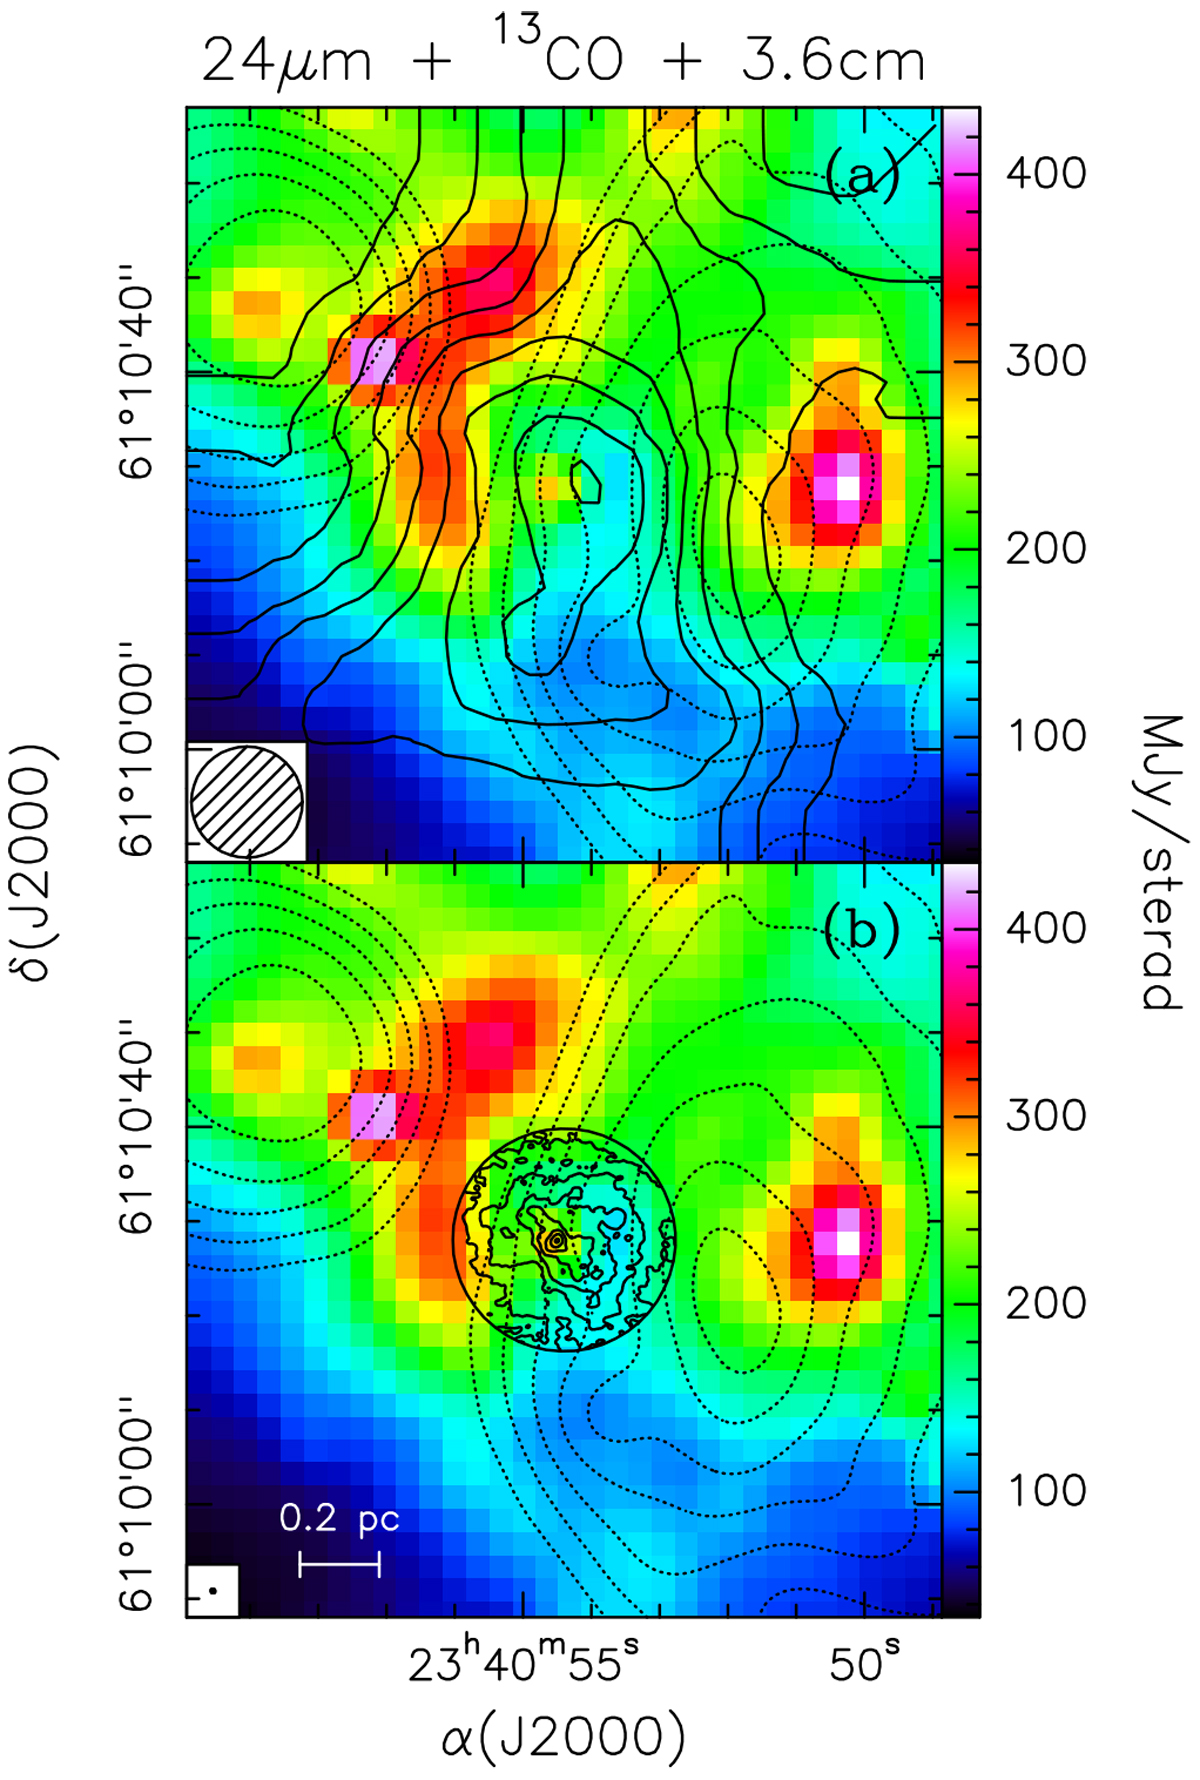
Panel a: map of the emission integrated over the 13CO(2–1) line (solid contours) overlaid on an image of the continuum emission at 24 μm (from Molinari et al. 2008b). The latter has an angular resolution of 6′′. The 13 CO map was obtained with the IRAM 30-m data at a resolution of 12′′ (the beam is shown in the bottom left corner). Solid contour levels range from 20 to 84 in steps of 8 K km s−1. The dotted contours represent a map of the 3.6 cm continuum emission imaged with the VLA Molinari et al. (2002) and range from 0.5 to 2.3 in steps of 0.3 mJy beam−1. The synthesized beam is 10′′.2 × 9′′.0 with PA = −59°. Panel b: same as top panel, where solid contours are a map of the emission averaged over the 13 CO(2–1) line, obtained after merging the NOEMA with the IRAM 30-m data. The resulting synthesized beam is 0′′. 49×0′′.44 with PA = 57° (shown in the bottom left corner). The circle corresponds to the half-power beam width of the NOEMA antennas. The contour levels range from 36 to 144 in steps of 18 mJy beam−1.
Current usage metrics show cumulative count of Article Views (full-text article views including HTML views, PDF and ePub downloads, according to the available data) and Abstracts Views on Vision4Press platform.
Data correspond to usage on the plateform after 2015. The current usage metrics is available 48-96 hours after online publication and is updated daily on week days.
Initial download of the metrics may take a while.