Free Access
Fig. 8
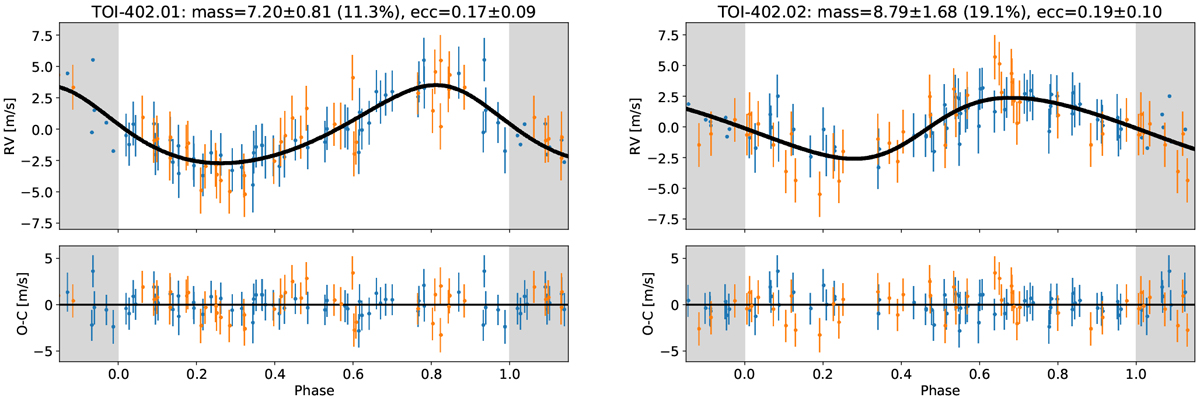
Phase-curves for TOI-402.01 and TOI-402. Top plots: best fitted planetary signal in the RV data after removing the instrument offsets, the second-order polynomial drift, and the GP regression. Bottom plots: RV residuals after removing the planetary signal.
Current usage metrics show cumulative count of Article Views (full-text article views including HTML views, PDF and ePub downloads, according to the available data) and Abstracts Views on Vision4Press platform.
Data correspond to usage on the plateform after 2015. The current usage metrics is available 48-96 hours after online publication and is updated daily on week days.
Initial download of the metrics may take a while.