Fig. 6
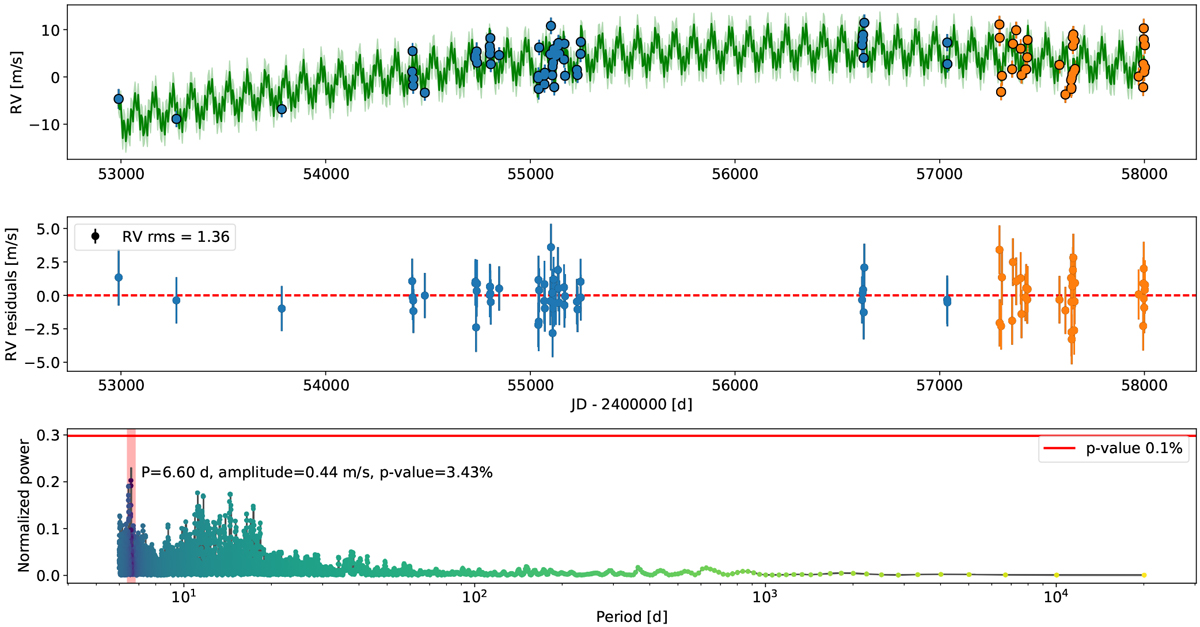
Top: best-fit model using the mean of all marginalised posterior PDFs obtained by the MCMC sampler over-plotted on the raw RV data of HD 15337 after removing the instrumental offset due to the change of the fibres on June 1, 2015. Middle: RV residuals after removing the best-fit model. The rms of this time-series is 1.36 m s−1. Bottom: GLS periodogram of the RV residuals that does not highlight any significant signals.
Current usage metrics show cumulative count of Article Views (full-text article views including HTML views, PDF and ePub downloads, according to the available data) and Abstracts Views on Vision4Press platform.
Data correspond to usage on the plateform after 2015. The current usage metrics is available 48-96 hours after online publication and is updated daily on week days.
Initial download of the metrics may take a while.