Fig. 5
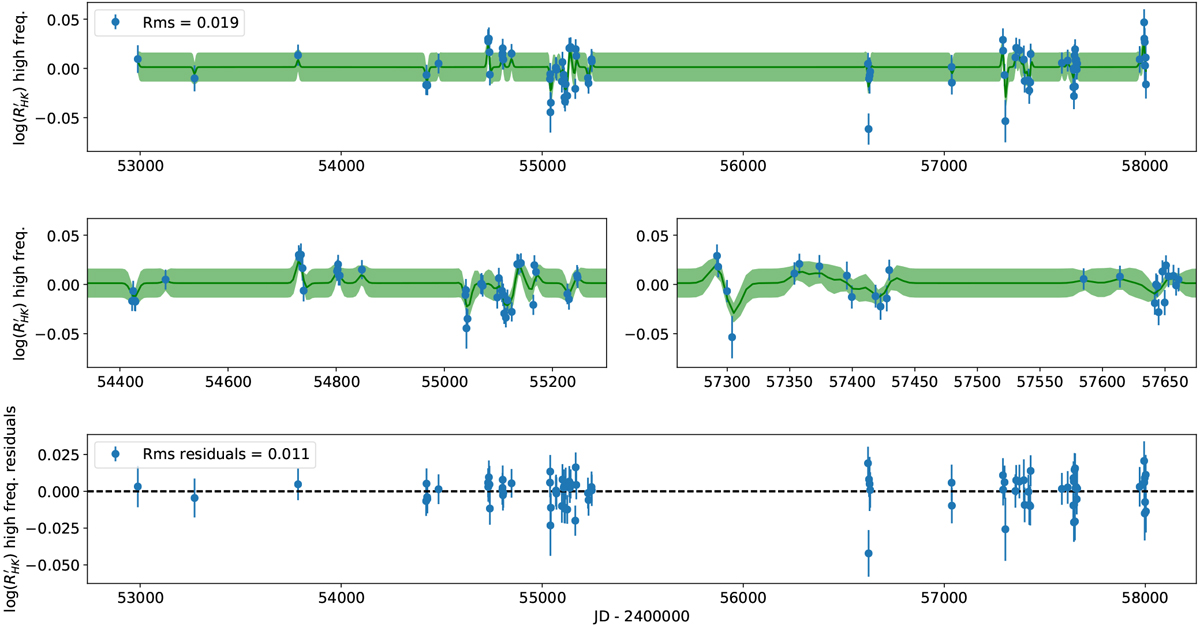
Top: Gaussian process regression over-plotted on the high-frequency ![]() time-series. The rms of those data is 0.019 dex. Middle: as in the top panel, however each subplot is a zoom on times where stellar activity is well sampled by the data. Bottom: residuals of the high-frequency
time-series. The rms of those data is 0.019 dex. Middle: as in the top panel, however each subplot is a zoom on times where stellar activity is well sampled by the data. Bottom: residuals of the high-frequency
![]() time-series after removing the GP regression. The rms of those residuals is 0.011 dex.
time-series after removing the GP regression. The rms of those residuals is 0.011 dex.
Current usage metrics show cumulative count of Article Views (full-text article views including HTML views, PDF and ePub downloads, according to the available data) and Abstracts Views on Vision4Press platform.
Data correspond to usage on the plateform after 2015. The current usage metrics is available 48-96 hours after online publication and is updated daily on week days.
Initial download of the metrics may take a while.