Fig. 4
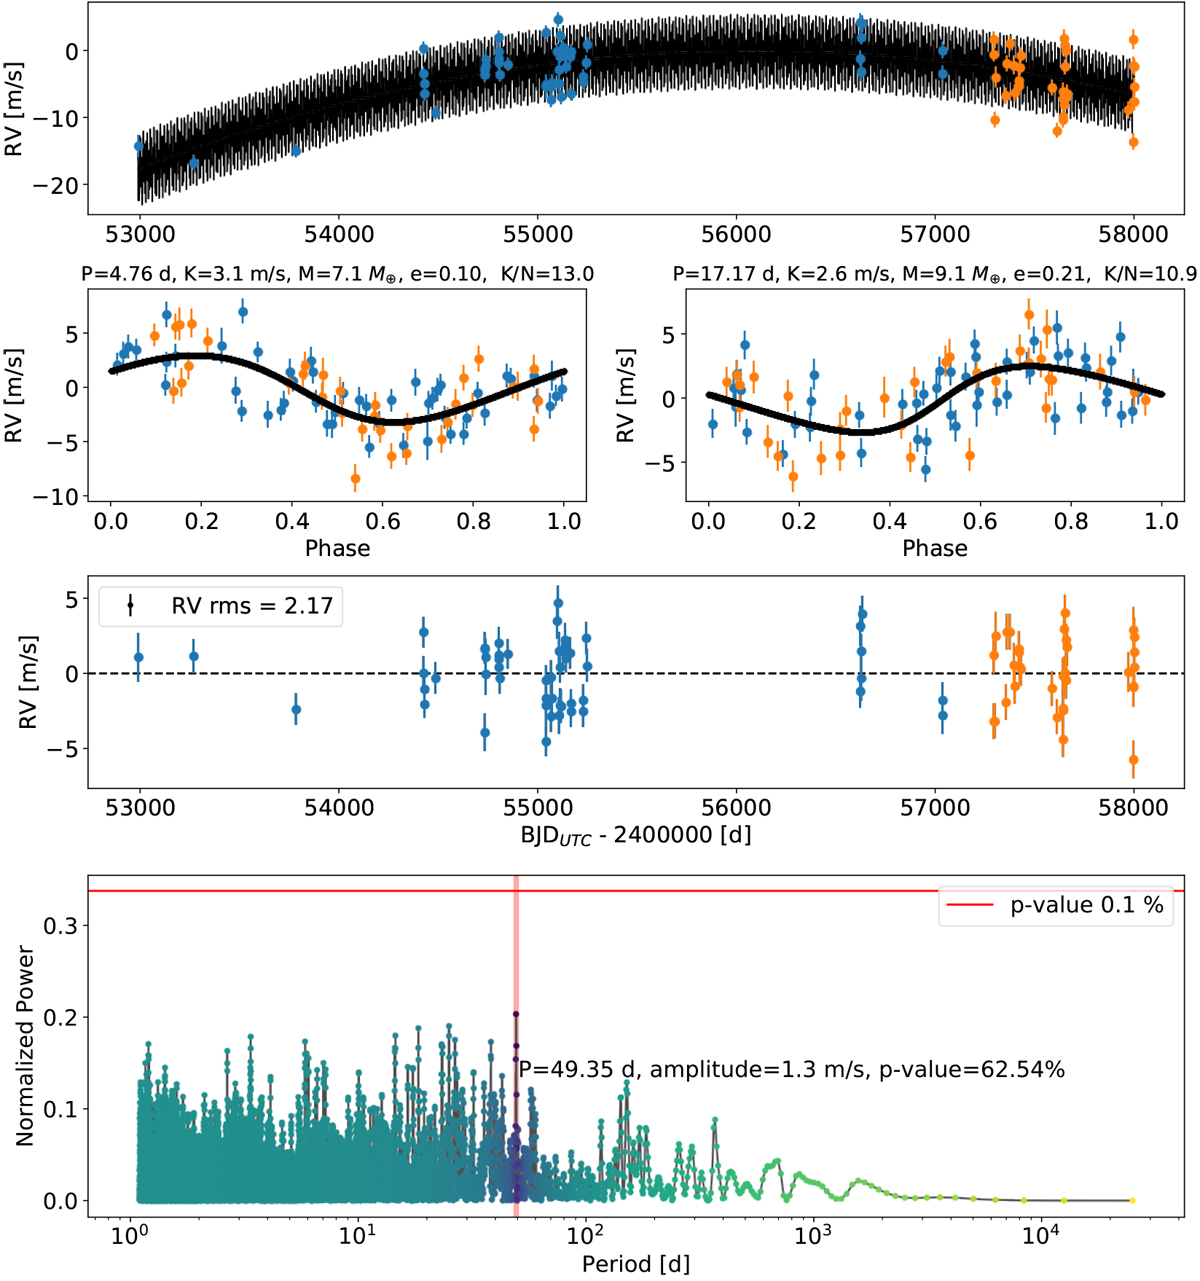
Top: best-fit model of our preliminary RV analysis over-plotted on the RV data of HD15337 after removing the instrumental offset due to the change of the fibres on June 1,2015. Second row: phase plot showing the RV signals of TOI-402.01 (left) and TOI-402.02 (right). The best-fit model is shown in black, and the orbital parameters and mass of the detected planets can be found in the title of the two subplots. Third row: RV residuals after fitting our best model. The rms of the residuals of 2.17 m s−1 is significantly higher than the average photon noise error of 0.9 m s−1. Bottom: GLS periodogram of the RV residuals showing no significant signals. Although no signal is seen, the fact that the rms of the residuals is much higher than the photon noise errors indicates that there is still significant activity signal in the residuals.
Current usage metrics show cumulative count of Article Views (full-text article views including HTML views, PDF and ePub downloads, according to the available data) and Abstracts Views on Vision4Press platform.
Data correspond to usage on the plateform after 2015. The current usage metrics is available 48-96 hours after online publication and is updated daily on week days.
Initial download of the metrics may take a while.