Fig. 2
![]() time-series analysis for HD 15337. Top: raw time-series and low-pass filter shown as the green line. Blue points represent the data obtained before the change of fibre on June 1, 2015, and orange points show the data obtained afterwards. Middle:
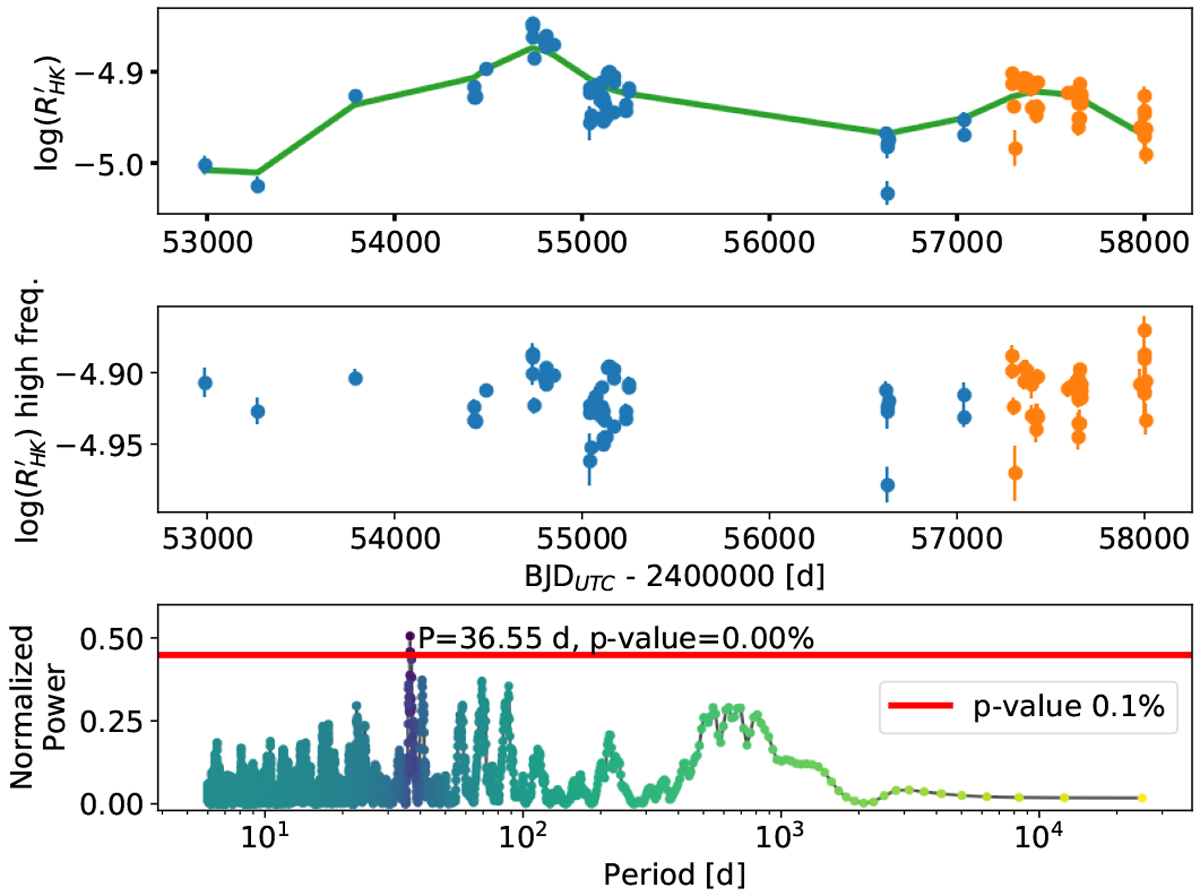
time-series analysis for HD 15337. Top: raw time-series and low-pass filter shown as the green line. Blue points represent the data obtained before the change of fibre on June 1, 2015, and orange points show the data obtained afterwards. Middle:
![]() residual time-series after removing the contribution of the low-pass filter. We refer to this time-series as the high-frequency
residual time-series after removing the contribution of the low-pass filter. We refer to this time-series as the high-frequency
![]() in the rest of the paper. Bottom: periodogram of the
in the rest of the paper. Bottom: periodogram of the ![]() residuals with the 0.1% p−value shown as the horizontal red line. A significant peak appears at 36.5 days corresponding to the stellar rotation period of HD 15337.
residuals with the 0.1% p−value shown as the horizontal red line. A significant peak appears at 36.5 days corresponding to the stellar rotation period of HD 15337.
Current usage metrics show cumulative count of Article Views (full-text article views including HTML views, PDF and ePub downloads, according to the available data) and Abstracts Views on Vision4Press platform.
Data correspond to usage on the plateform after 2015. The current usage metrics is available 48-96 hours after online publication and is updated daily on week days.
Initial download of the metrics may take a while.