Fig. 10
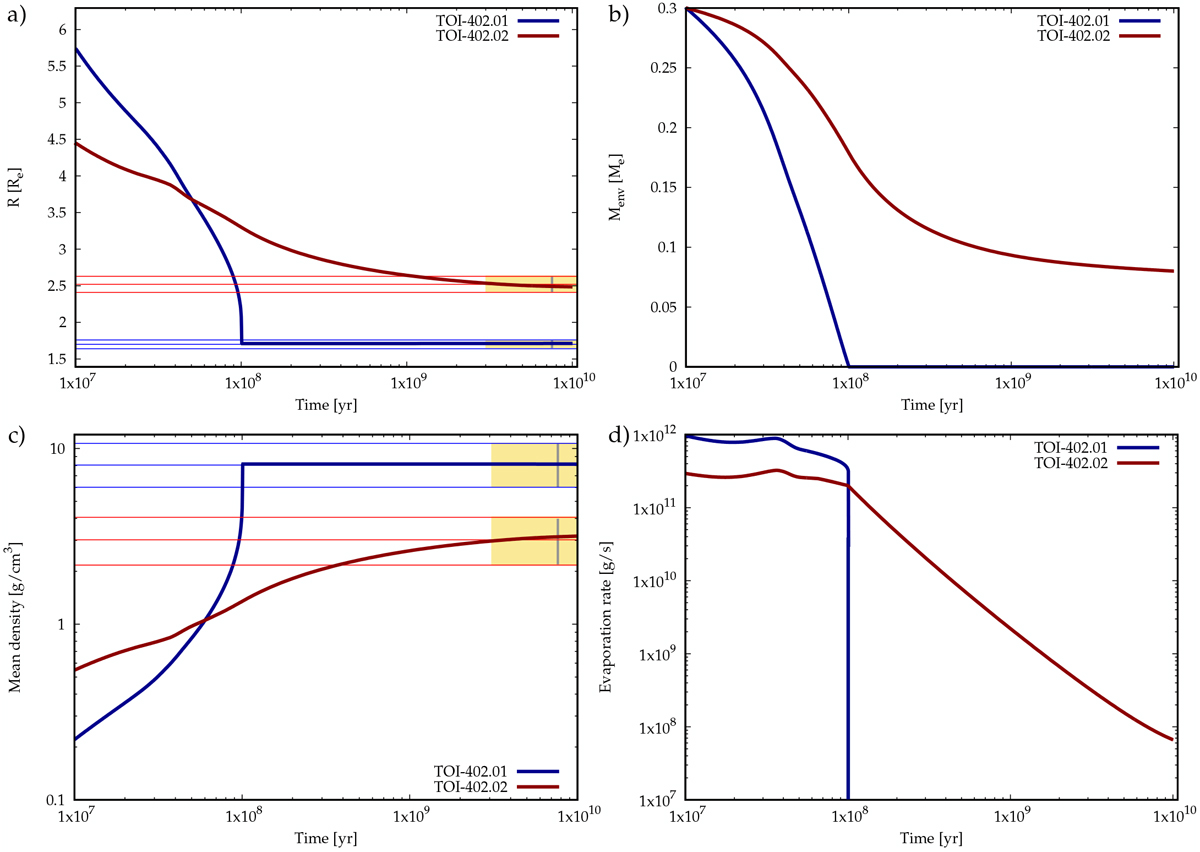
Temporal evolution of the TOI-402 planets. The panels show as a function of time (a) the transit radius (in Earth radii), (b) the mass of the H/He envelope (in Earth masses), (c) the mean density of the planets, and (d) the XUV-driven hydrodynamic H/He evaporation rate. In the two panels on the left, the horizontal lines show the observed values and the 1-σ error intervals. The yellow region indicates the 1-σ age range of the star, with the vertical grey line showing the nominal age of 7.5 Gyr.
Current usage metrics show cumulative count of Article Views (full-text article views including HTML views, PDF and ePub downloads, according to the available data) and Abstracts Views on Vision4Press platform.
Data correspond to usage on the plateform after 2015. The current usage metrics is available 48-96 hours after online publication and is updated daily on week days.
Initial download of the metrics may take a while.