Fig. 1
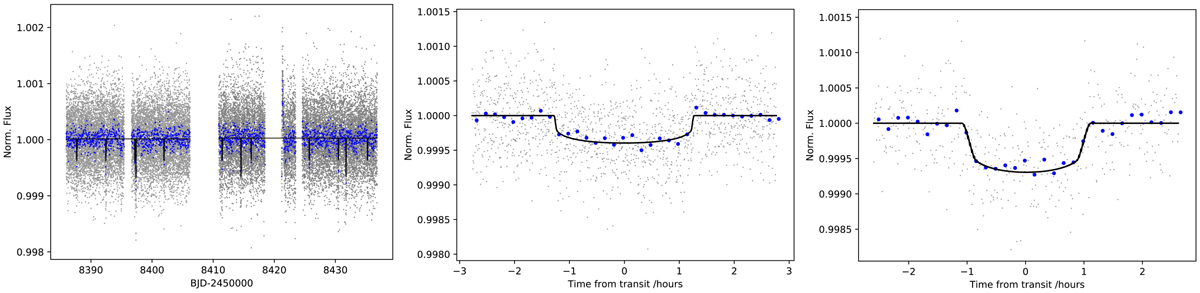
Left: full PDCSAP light curve from TESS after removing the smoothing model described in Sect. 3.2. The grey points represent the raw measurements, while the blue dots are the same data binned over 10 min. The model showing the best fit to the light curve with two planets corresponding to TOI-402.01 and TOI-402.02 is shown as the black curve. Middle: light curve phase-folded in phase to highlight the transit of TOI-402.01 and the best-fit model. Right: as in the middle plot, but for TOI-402.02.
Current usage metrics show cumulative count of Article Views (full-text article views including HTML views, PDF and ePub downloads, according to the available data) and Abstracts Views on Vision4Press platform.
Data correspond to usage on the plateform after 2015. The current usage metrics is available 48-96 hours after online publication and is updated daily on week days.
Initial download of the metrics may take a while.