Fig. 1.
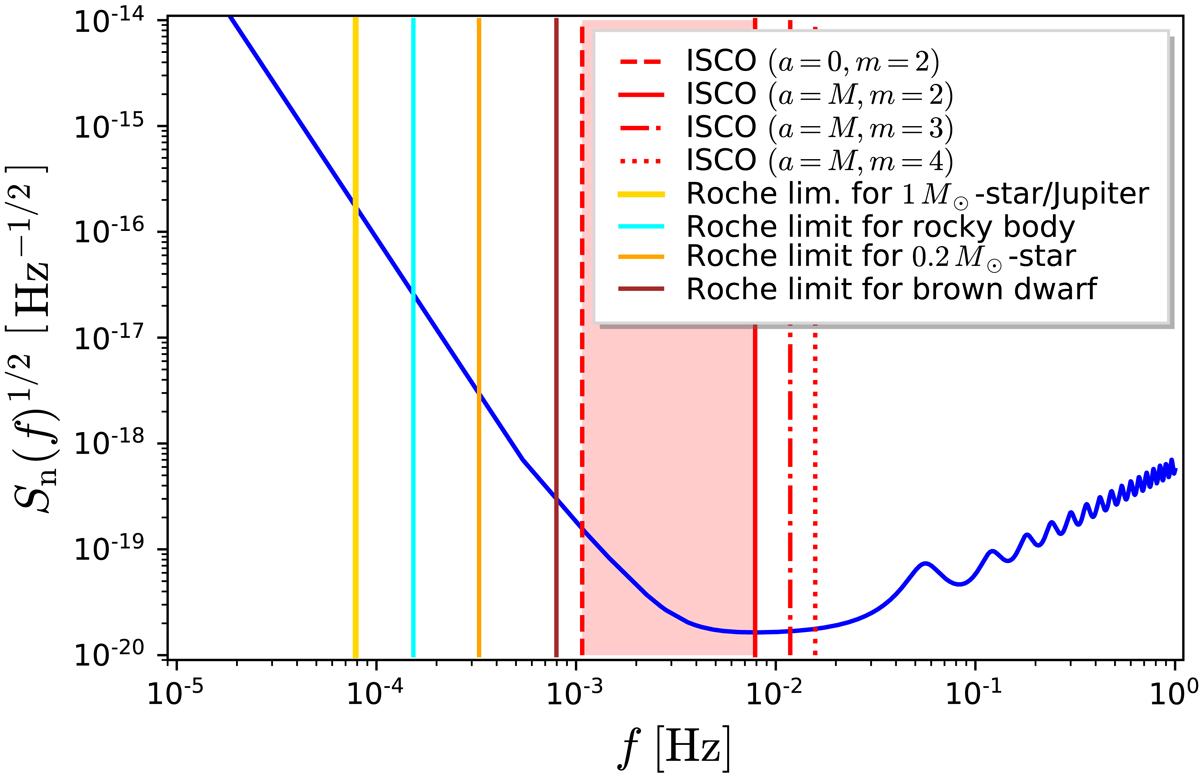
LISA sensitivity curve (Amaro-Seoane et al. 2017) and various gravitational wave frequencies from circular orbits around Sgr A*. The wave frequencies shown above are all for the dominant m = 2 mode, except for the dot-dashed and dotted vertical red lines, which correspond to the m = 3 and m = 4 harmonics of the ISCO of an extreme Kerr BH (a = M). The shaded pink area indicates the location of the frequencies from the ISCO when a ranges from zero to M. The Roche limits are those discussed in Sect. 5.1.
Current usage metrics show cumulative count of Article Views (full-text article views including HTML views, PDF and ePub downloads, according to the available data) and Abstracts Views on Vision4Press platform.
Data correspond to usage on the plateform after 2015. The current usage metrics is available 48-96 hours after online publication and is updated daily on week days.
Initial download of the metrics may take a while.