Fig. 8.
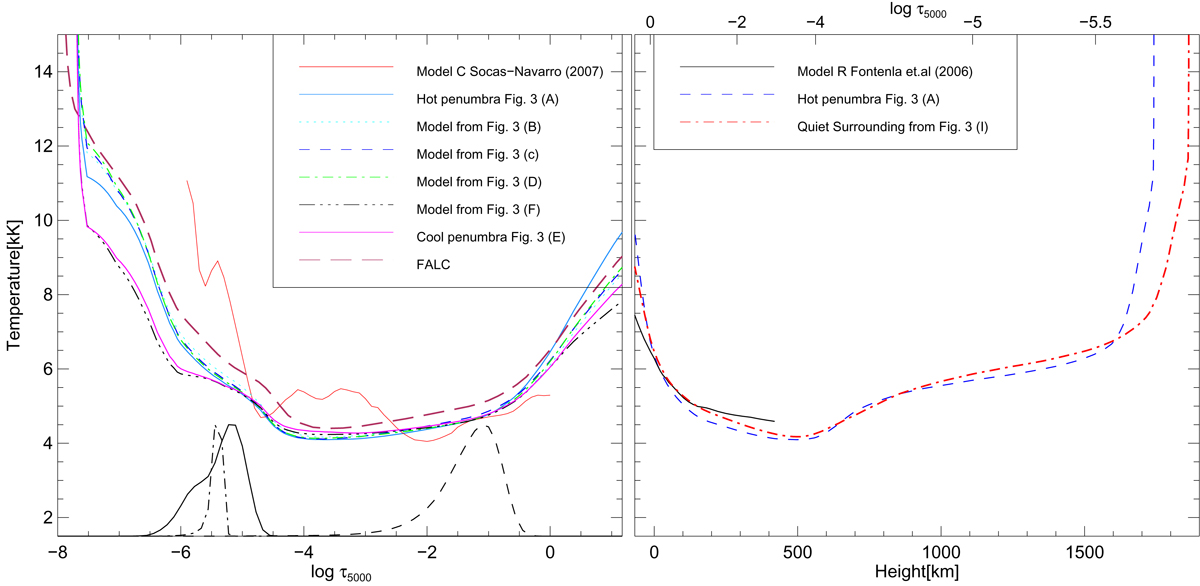
Comparison of the temperature stratification with optical depth for the different penumbral atmospheres indicated in Fig. 3. Left panel: temperature stratification of six different models corresponding to the six different pixels in the penumbra of the sunspot as a function of optical depth. The model with the lowest uncertainty from Socas-Navarro (2007), is also shown for the sake of comparison. Contribution functions computed from the cool penumbral model for the Mg II k2v, Ca II 8542 core, and Ca II wing-averaged over the wavelength range between 8541.15 Å and 8542.28 Å, are plotted (in arbitrary units) with solid, dash-dotted, and dashed lines, respectively. Right panel: temperature stratification as a function of geometric and optical depth of our hot penumbral and quiet surrounding model compared to the purely photospheric model-R of Fontenla et al. (2006).
Current usage metrics show cumulative count of Article Views (full-text article views including HTML views, PDF and ePub downloads, according to the available data) and Abstracts Views on Vision4Press platform.
Data correspond to usage on the plateform after 2015. The current usage metrics is available 48-96 hours after online publication and is updated daily on week days.
Initial download of the metrics may take a while.