Fig. 4.
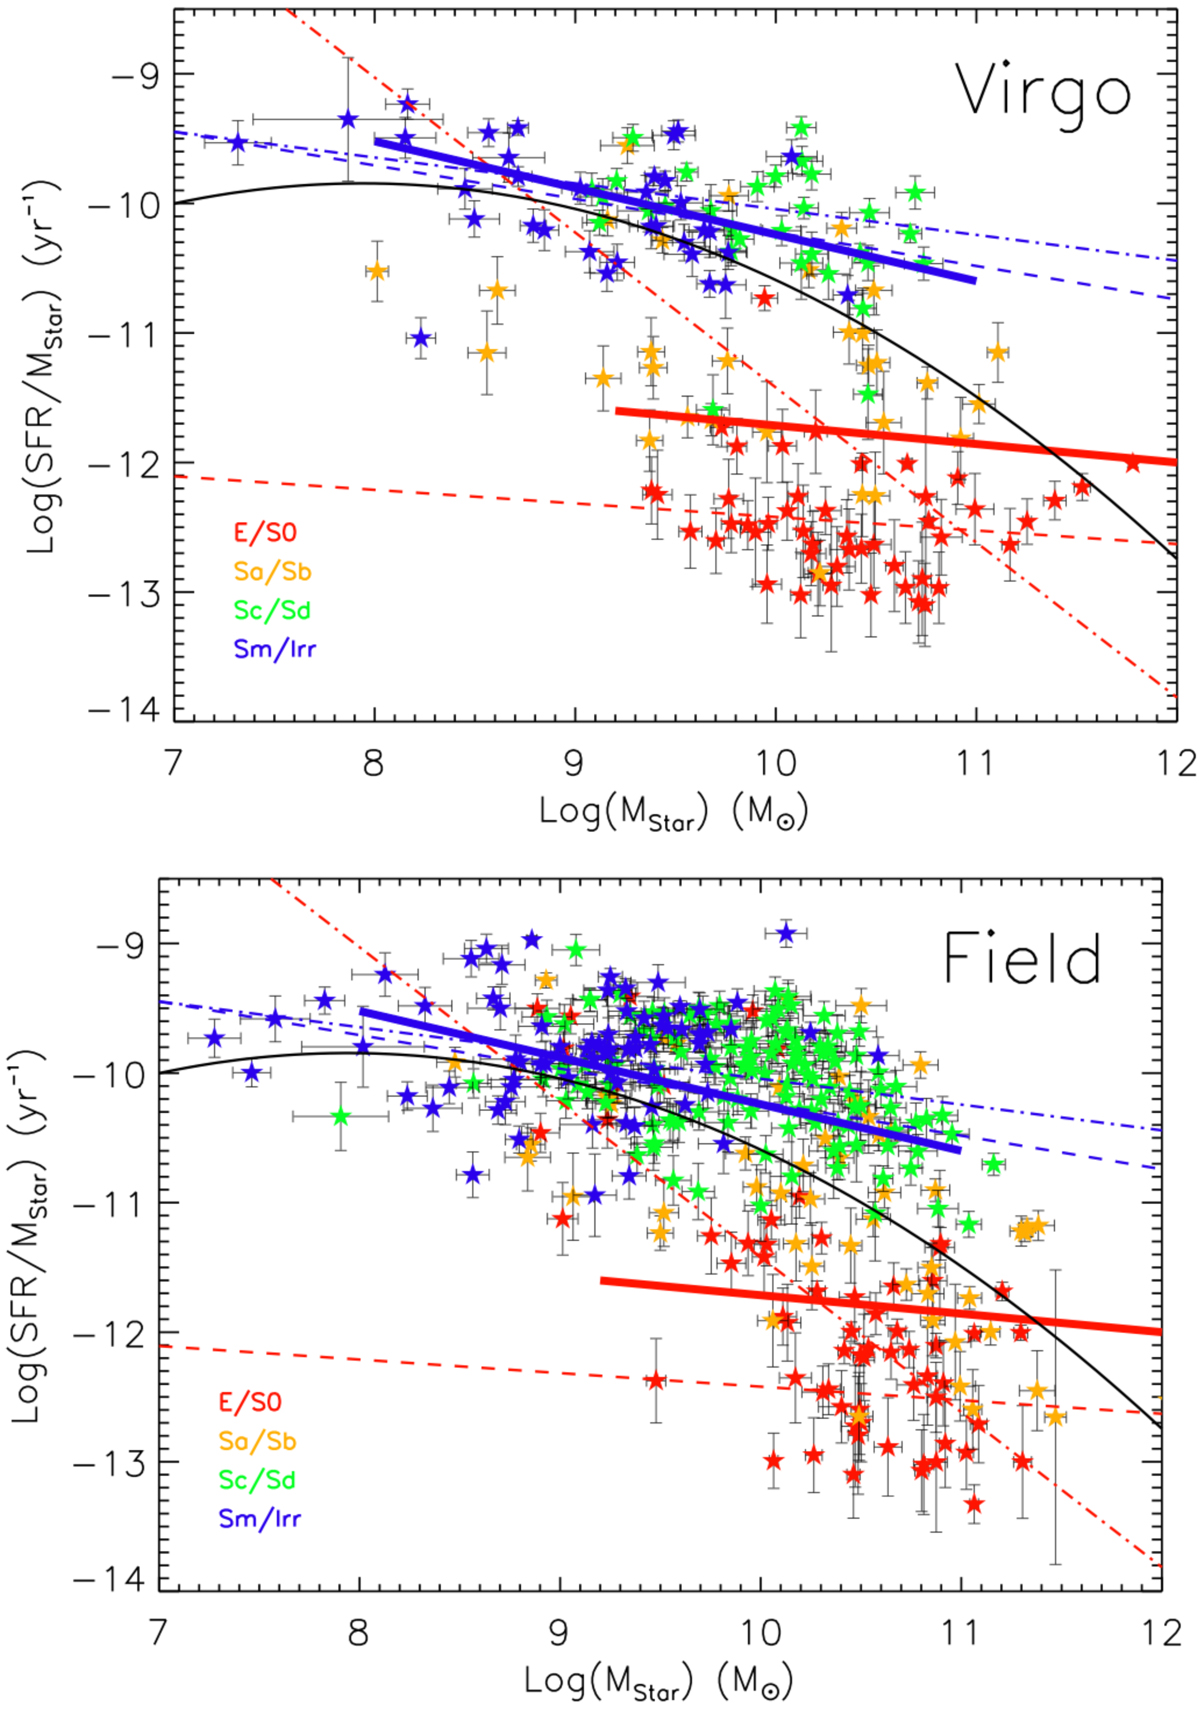
“Main sequence” for our data defined by the stellar mass (M⊙) and SSFR (yr−1). Galaxies are distinguished by their morphological type and whether they are members of the Virgo cluster (top) or in the field (bottom). The thick blue line is the locus of the galaxy main sequence and the red line the locus of “non-star forming” galaxies as defined by Schiminovich et al. (2007). For comparison the dashed lines are linear fits to the late (Sc/Sd, Sm/Irr) and early types (E/S0) in Virgo (dash) and the field (dot-dash). The solid black line is the proposed fit to the data used by Eales et al. (2017).
Current usage metrics show cumulative count of Article Views (full-text article views including HTML views, PDF and ePub downloads, according to the available data) and Abstracts Views on Vision4Press platform.
Data correspond to usage on the plateform after 2015. The current usage metrics is available 48-96 hours after online publication and is updated daily on week days.
Initial download of the metrics may take a while.