Free Access
Fig. 4.
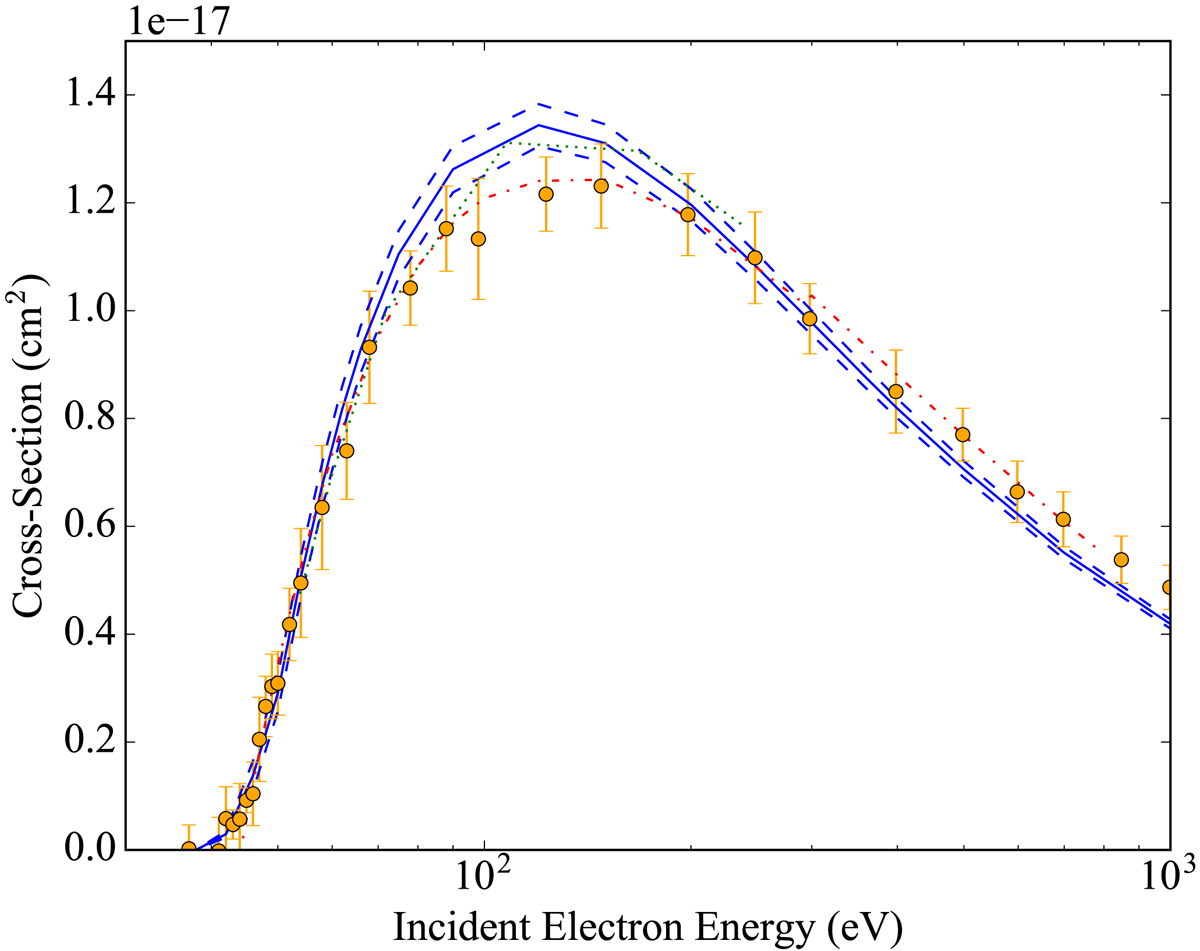
Combined DI cross section for C III with 40% metastable population; blue solid line – this work, blue dashed – difference in cross section owing to metastable population uncertainty, green dotted – Younger (1981), red dash-dotted – Fogle et al. (2008) R-Matrix, orange circles – Woodruff et al. (1978) experiment.
Current usage metrics show cumulative count of Article Views (full-text article views including HTML views, PDF and ePub downloads, according to the available data) and Abstracts Views on Vision4Press platform.
Data correspond to usage on the plateform after 2015. The current usage metrics is available 48-96 hours after online publication and is updated daily on week days.
Initial download of the metrics may take a while.